Why Most Trading Journals Lie to You (And How to Actually Improve Your Edge)
Win rate rising while expectancy stays flat? Minimum journal schema, compliance bands, tag ranking, and the exact 45-minute weekly review — works in Excel or any app.
Win rate climbed from 48% to 58% over eighty trades. You felt sharper. Expectancy in R barely moved: still roughly −0.05 per trade on your main setup. The journal showed green weeks. It never showed that average winner R had shrunk while losers still averaged −1R, or that you skipped tags on 70% of losing trades.
Your journal was not falsifying P&L. It was incomplete. It stored outcomes (entry, exit, dollars) and stayed silent on compliance, position-sizing consistency, exit quality, regime fit, and the behavioral tags that repeat on your largest losers.
This guide explains what a forensic trade journal must capture, how to build the minimum schema in Excel or any app, and how to run a 45-minute weekly review that answers real questions instead of rewriting stories from memory.
Key takeaways: (1) Win rate and dollar P&L can improve while expectancy in R stays flat. (2) Compliance bands (green ≥80%, amber 50–79%, red <50%) separate process from outcome. (3) Controlled tags rank leaks at scale, stories do not. (4) A 45-minute weekly loop (compliance → expectancy → tag ranking → one rule) beats post-session narratives. (5) Excel works until ~150 trades; graduate when pivots slow or compliance becomes optional.
Written by The Final Tape team, built for traders who measure discipline in data, not stories.
Terms in this guide: Outcome logging = symbol, prices, fees, net P&L. Process logging = named setup, checklist compliance %, planned risk, regime, and controlled tags at submit time. Canonical R = realized P&L ÷ the same planned risk definition every trade. Compliance band = green ≥80%, amber 50–79%, red <50% of setup rules met. Excursion = how far price moved in your favor or against you after exit (MFPE / MAPE).

The dangerous gap between win rate and expectancy
Outcome logging asks: Did I make money? Process logging asks: Did I execute the defined setup under the defined risk rules in the defined regime, regardless of result?
| Question | Outcome-only journal | Process journal |
|---|---|---|
| Was this my A+ setup? | Inferred from P&L color | Setup name + compliance % at submit |
| Did I size correctly? | Guess from dollar P&L | Planned risk $ and risk % version |
| Why did I exit early? | Forgotten by Friday | Exit tag + optional excursion data |
| Is edge improving? | Win rate and dollar curve | Expectancy in R on compliance-filtered rows |
| What to fix next week? | Vague intention | Top ranked negative tag → one rule |
Same eighty-trade sample as the opener, reviewed properly:
Full book
58% wins, expectancy ≈ −0.05R (looks "almost there")
Compliance ≥80% only
41 trades, expectancy ≈ −0.12R (worse, not better)
Avg winner R
+0.61 (down from +1.1 six months ago)
Avg loser R
−1.04 (still full stops)
Top exit tag on winners
"Fear exit" on 62% of wins under +1R
Tags on losers
Logged on only 30% of losses (survivorship in the tag column)
Try this: Filter your last 20 losers. What % have a non-empty exit_tag? If it is under 50%, your journal is lying by omission, not by bad math.
A +$800 day might be three low-compliance winners with poor exit quality. A −$400 day might be four high-compliance losers in a valid regime: good process, bad variance. Dollar color cannot separate those.
Normalize in R-multiples for weekly edge review. Prop traders: pair with the 1% rule so planned risk never drifts with equity.
What a minimum viable journal schema actually looks like
Lock these columns before trade one. Same headers whether you use Sheets, Notion, or structured software.
| Column | What to store | Why it matters |
|---|---|---|
| portfolio_id | Eval vs funded vs personal | Never blend books in one expectancy pivot |
| setup_name | Published checklist name | Edge is setup-specific, not account-wide |
| compliance_% | Rules met ÷ rules total at submit | Separates process fidelity from outcome |
| planned_risk_$ | Dollar loss if stop hits at size | Denominator for canonical R |
| net_pnl | After fees | Numerator for R |
| realized_r | = net_pnl / planned_risk_$ | Comparable across sizes and phases |
| regime_tag | Trend / chop / news / etc. | Edge is often regime-dependent |
| entry_tag | Controlled dropdown | Rank leaks; avoid free-text stories |
| exit_tag | Target hit / fear exit / trail / etc. | Explains avg winner R compression |
| risk_%_version | e.g. static_1pct_v1 | Detects mid-month formula drift |
Academy chain: portfolio → risk method → risk % . Skipping that chain is how journals lie from day one.
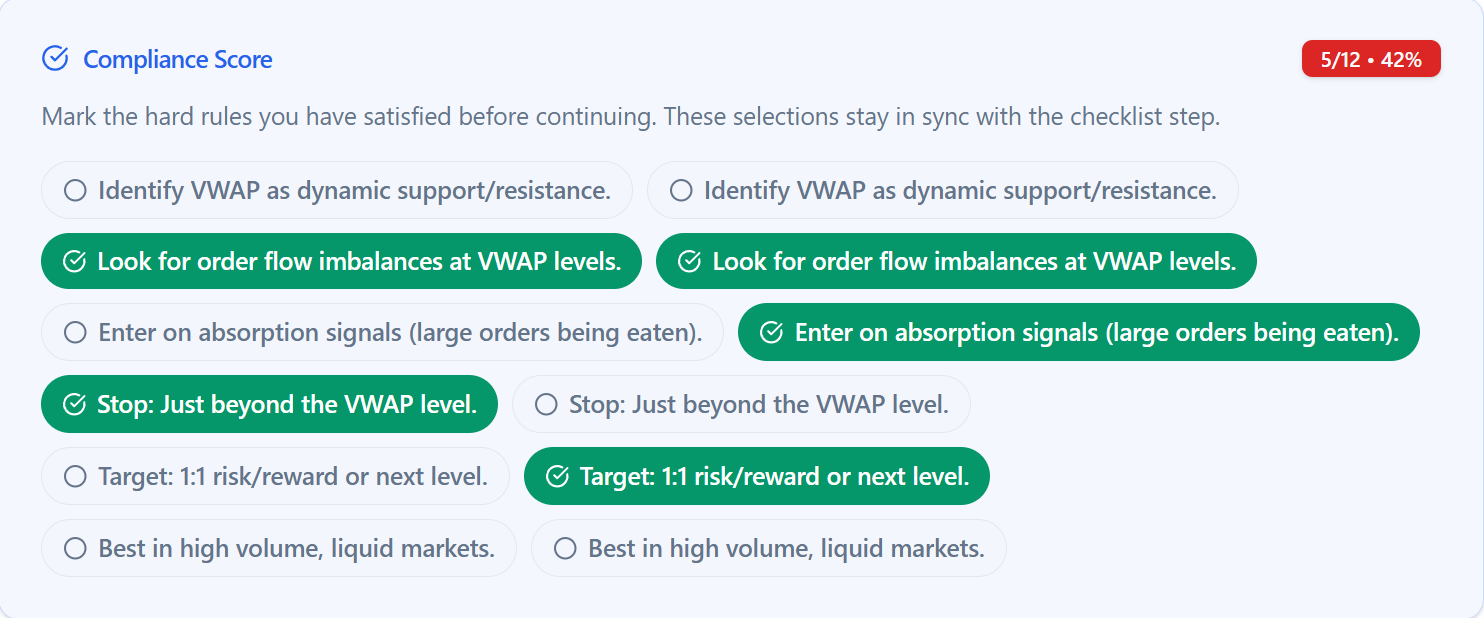
How to build compliance bands that protect your edge
Compliance score = rules satisfied from your selected setup checklist, checked at submit, not rewritten after a loss.
Green ≥80%
Process fidelity; learn from outcome second
Amber 50–79%
Partial adherence; note which rules broke
Red <50%
Out-of-process; exclude from setup-level expectancy
Filter to high-compliance trades only. Negative expectancy there = setup revision. Low-compliance winners clustered = scaling leaks. Deep dive: compliance scoring (episode 10).
High-compliance loser = data. Low-compliance winner = leak waiting for larger size.
Tag ranking: the missing layer most traders ignore
Every discretionary trader has stories: fear exit, added to a loser, FOMO entry, revenge trade. Stories do not rank at eighty trades. Controlled tags do.
Entry tags
FOMO, planned trigger, late chase, news impulse
Execution tags
Full size, half size, moved stop, no stop logged
Exit tags
Target hit, fear exit, trail stop, time stop
Regime tags
Trend, chop, high vol, low liquidity
Monthly: sort most frequent negative tags on losing trades. Fix top three before adding setups. Use a Playbook or a strict dropdown column, not a diary paragraph. Psychology tracking belongs in the same row as the trade.
Exit quality and excursions
Most journals end at exit price. Markets do not. MFPE (max favorable post-exit) and MAPE (max adverse post-exit) show what price did after you left.
Without excursions
Cannot separate lucky exit from good exit
Fear exit + high MFPE
Systematic R left on table
Full stop + low MAPE
Stop placement may be fine; variance was real
Manual DIY
Note post-exit high/low in R units on a subset of trades weekly
Academy: excursions (episode 8). At scale, analytics modules rank exit behavior from the same fields your journal writes.
Want automated compliance scoring and tag ranking on every trade? See trade review software and the AI Council Kill List workflow, ranked leaks by dollar impact, not memory.

The 45-minute weekly review that actually moves the needle
Step 1: Compliance check (minutes 0–10)
Pull your last 20 trades. Filter to compliance ≥80%. If fewer than 70% of the book meets that bar, stop, fix logging discipline before reviewing edge. No expectancy math on incomplete rows.
Step 2: R-multiple and expectancy analysis (minutes 10–25)
On compliance-filtered rows only: calculate expectancy in R, average winner R, and average loser R. Compare to the full book. A green full-book week with negative filtered expectancy is a warning, not confirmation.
Step 3: Tag ranking on losers (minutes 25–35)
Sort negative tags on losing trades by frequency × average R lost. Pick the top tag as your single fix candidate for next week. Do not fix three things, fix one.
Step 4: One Kill List rule for next week (minutes 35–45)
Write one specific, testable behavioral rule tied to the top tag. Add it to your Kill List if you use one. Example: "No manual exit before +1R unless stop is at breakeven."
Download the Weekly Journal Review Checklist (PDF), print it or save it beside your desk for every Friday session.
Full loop walkthrough: how to keep a trading journal . Turn the week-4 rule into a ranked item: Kill List workflow .
Run this exact review 10× faster with automated compliance audits and tag ranking. Try The Final Tape free or explore the AI trading journal guide.
Why this process works in Excel — and when you should upgrade
Excel works until trade ~150, when formulas drift and loser tagging stops. Full migration signals: journal vs spreadsheet .
Formula drift
Risk % cell edited mid-month; historical R incomparable
No checklist object
Compliance becomes a vibe
Free-text tags
Cannot pivot "fear exit" vs "Fear exit"
No excursions
Exit quality stays anecdotal
Rounded CSV imports
Partial fills and fees vanish
No filter speed
Cannot slice setup + compliance in under ten seconds
Structure beats willpower. Prop-specific checklist: prop firm journal guide .
Common journal lies traders tell themselves
Spreadsheets, Notion templates, and basic apps are excellent at outcome logging. That is necessary. It is not sufficient for edge measurement or prop survival.
Screenshot journaling
One-line story after the close, written to justify the result
Win/loss tallies
Counts without R normalization across sizes
Missing compliance
No checklist score tied to a named setup
Missing tags
No taxonomy on entry, execution, exit, or regime
Missing excursions
No post-exit price path for exit quality
Risk drift
Risk % changed mid-month without versioning historical rows
Green-day sizing
Size up after wins without logging the decision
Blended books
Backtest and live rows in one portfolio
Skipped loser tags
Most teachable trades stay invisible
Dollar drawdown review
Emotional zoom replaces statistical zoom
If you cannot filter by setup name and compliance band in under ten seconds, the review workflow is broken before the strategy is.
Prop firm journals in plain English
Evaluations punish risk drift and rule ambiguity. Static risk on starting balance keeps dollar risk fixed while equity moves. Named setups with checklists prove which trades counted toward edge and which were improvisation.
Day 1 chain mirrors what funded desks expect: portfolio , risk method , risk % . Philosophy: Academy welcome .
30-day journal fix
- Week 1
Lock portfolio, risk method, starting balance, 1% default; add schema columns
- Week 2
Log 10 trades with full checklist and 4–8 tags each; tag every loser
- Week 3
Review in R; compliance ≥80% filter; list top 3 negative tags
- Week 4
Execute one Kill List item; re-tag skipped losers; note excursion on 5 trades
Futures and crypto: fee and session nuances in futures and crypto guides.

Stop reviewing from memory
The market has already judged you. Your journal should produce a certified transcript: process fidelity, behavioral honesty, and measurable edge in R. Compliance filter → tag ranking → one Kill List rule. Repeat weekly.
Tired of manual reviews? The Final Tape automatically flags compliance issues, ranks tag leaks, and surfaces Kill List items from your completed trades. Explore the Academy , AI Council , and Charter Elite, or view pricing for a live demo.
Frequently asked questions
Why is my win rate up but I still lose money?
Win rate ignores position size and exit quality. Average winner R may have shrunk while losers still hit full −1R stops. Review expectancy in R on compliance-filtered rows, not dollar color or win counts alone.
What should a trading journal include?
Minimum: setup name, compliance %, planned risk $, realized R, regime tag, entry/exit tags, fees. Add excursions when possible. P&L alone cannot measure edge.
How often should I review?
Log daily (two minutes per trade with defaults locked). Weekly: compliance-weighted expectancy and top negative tags. Monthly: full tag audit and one behavioral rule closed.
Is Excel enough?
Yes for storage and early books if you enforce the schema table above, version risk %, and use dropdown tags. Graduate when pivots slow down or compliance becomes optional in practice.
Best journal for prop firm traders?
One that enforces static risk on starting balance, per-trade planned risk, and compliance per setup so eval rules and journal data stay aligned. See our prop firm guide.
When do I need AI or automation?
Past ~200 trades, manual review misses micro-patterns (size creep, regime-specific tags). Automation ranks; you still execute one fix at a time.
What is a "certified transcript"?
The review artifact you would show a mentor or prop risk manager: process fidelity, tag honesty, and expectancy in R, not a screenshot folder.
Stop reviewing from memory
Run compliance scoring, tag ranking, and Kill List rules on every trade — not once a month when the account feels off.