A Structured Introduction to Effective Trading Journaling and Analytics
Foundational principles of structured journaling, the metrics that matter, and a weekly loop that turns data into ranked fixes.
A trading journal is not a diary. It is a measurement system for execution quality, risk discipline, and edge decay. When structured correctly, journaling plus analytics turns subjective memory into ranked, testable fixes — the same loop prop desks and funded traders use before they scale size.
Why Most Trading Journals Fail to Deliver Results
Most journals fail for predictable reasons — not because traders are lazy.
- Inconsistent fields — Different data on winners vs losers makes edge math meaningless.
- Evening storytelling — Reconstructing trades from memory adds bias; log at submit.
- P&L-only review — Dollar color hides process leaks until drawdown forces attention.
- No compliance filter — Mixing rule-following trades with impulsive entries poisons stats.
- Review without ranking — Listing mistakes without dollar impact produces guilt, not fixes.
The Minimum Structure Every Journal Needs
Before advanced analytics, every trade row must capture the same core fields:
- Setup / tag — what you traded and why
- Planned risk (R) — size and stop defined before entry
- Entry, exit, and excursion prices — MAE/MFE when available
- Compliance score — did you follow your checklist?
- Outcome in R-multiples — not just dollars
Key Analytics Metrics That Actually Matter
- Expectancy in R — Average winner R minus average loser R on compliant trades only.
- Compliance rate — Percent of trades that pass your checklist; sub-80% means leaking.
- Tag ranking on losers — Which labels appear most on negative R in the green set.
- MAE / MFE distribution — Whether stops and targets match actual excursion.
- Drawdown forensics — When losses cluster by day, session, or setup.
How to Move From Data Collection to Insight
- Filter to ≥80% compliance trades only
- Recalculate expectancy and average R win/loss
- Rank negative tags on losers in that set
- Write one testable Kill List rule for next week
Common Mistakes Beginners Make
- Logging only screenshots without structured fields
- Changing risk mid-week after a loss streak
- Tagging everything as "FOMO" instead of specific setup labels
- Skipping missed trades — often the highest-signal rows
- Abandoning the journal after two green weeks
Your First Action Step
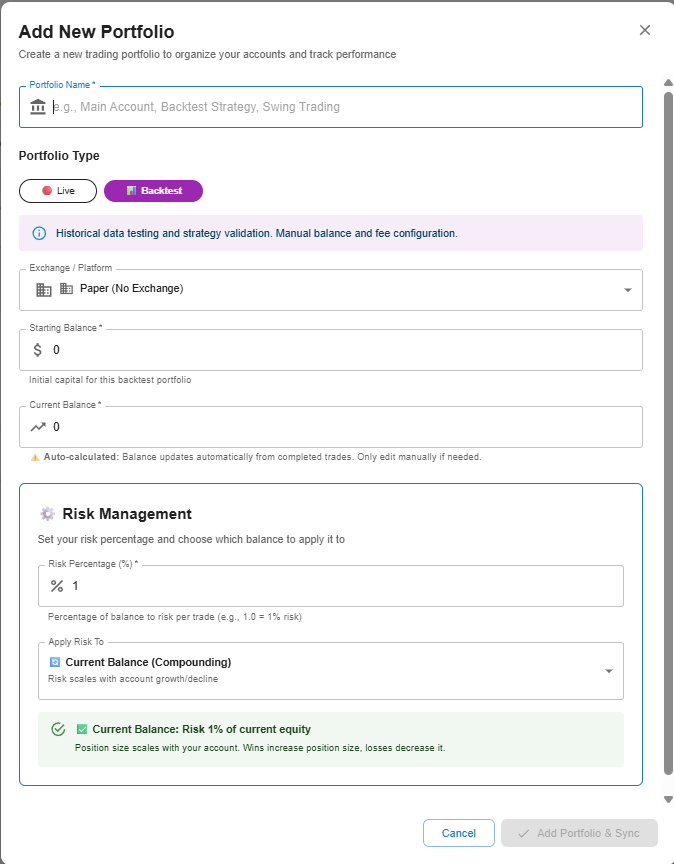
- Create one portfolio with fixed starting balance
- Set default risk % (typically 0.5–1%) and do not change it this week
- Define one checklist with 3–5 non-negotiable rules
- Log your next 5 trades at submit — not at end of day
- Schedule one 45-minute review block on the same weekday each week
Next Lessons in This Series
Lesson 2 walks through portfolio creation in under 60 seconds. Lesson 3 covers static vs compounding sizing — the single setting that affects prop compliance and long-term growth.
Ready to put this into practice?
Run compliance scoring, tag ranking, and Kill List rules on every trade — not once a month when the account feels off.