AI Council — Agent 1 of 8
Performance Analyst
Profitability & statistical edge
The Performance Analyst is the quantitative backbone of AI Council. It reads your portfolio metrics, equity curve, and R-multiple distribution to determine whether your edge is stable, improving, or silently decaying — independent of a lucky streak or a bad week.
What it reads from your tape
The Performance Analyst receives pre-aggregated metrics from your completed trades — not a generic chat summary. Every input comes from your canonical trade tape.
- →Win rate, profit factor, Sharpe/Sortino/Calmar ratios
- →R-multiple distribution and expectancy by period
- →Equity curve shape and drawdown recovery
- →Streak stability (win/loss clusters)
- →Benchmark comparisons vs. your historical baseline
What it detects
- Expectancy collapse across rolling windows
- Streak instability and variance spikes
- Win-rate distortion masking negative expectancy
- Edge inconsistency between recent and older periods
What it delivers
- Performance grade and consistency score
- Profitability diagnostics with strengths and weaknesses
- Expectancy decomposition by setup and period
- Statistical deterioration warnings with evidence
Example finding
“ORB setup: +0.42R at 94% compliance, −0.18R below 80%”
How it fits the Council
The Performance Analyst runs in parallel with six other specialists on the same audit period. Each agent sees metrics tuned to its domain. When specialists disagree, they debate transparently in The Situation Room before the Chief Coaching Officer synthesizes everything into a dollar-ranked Kill List.
Learn about the full AI Council pipelineMeet the other agents
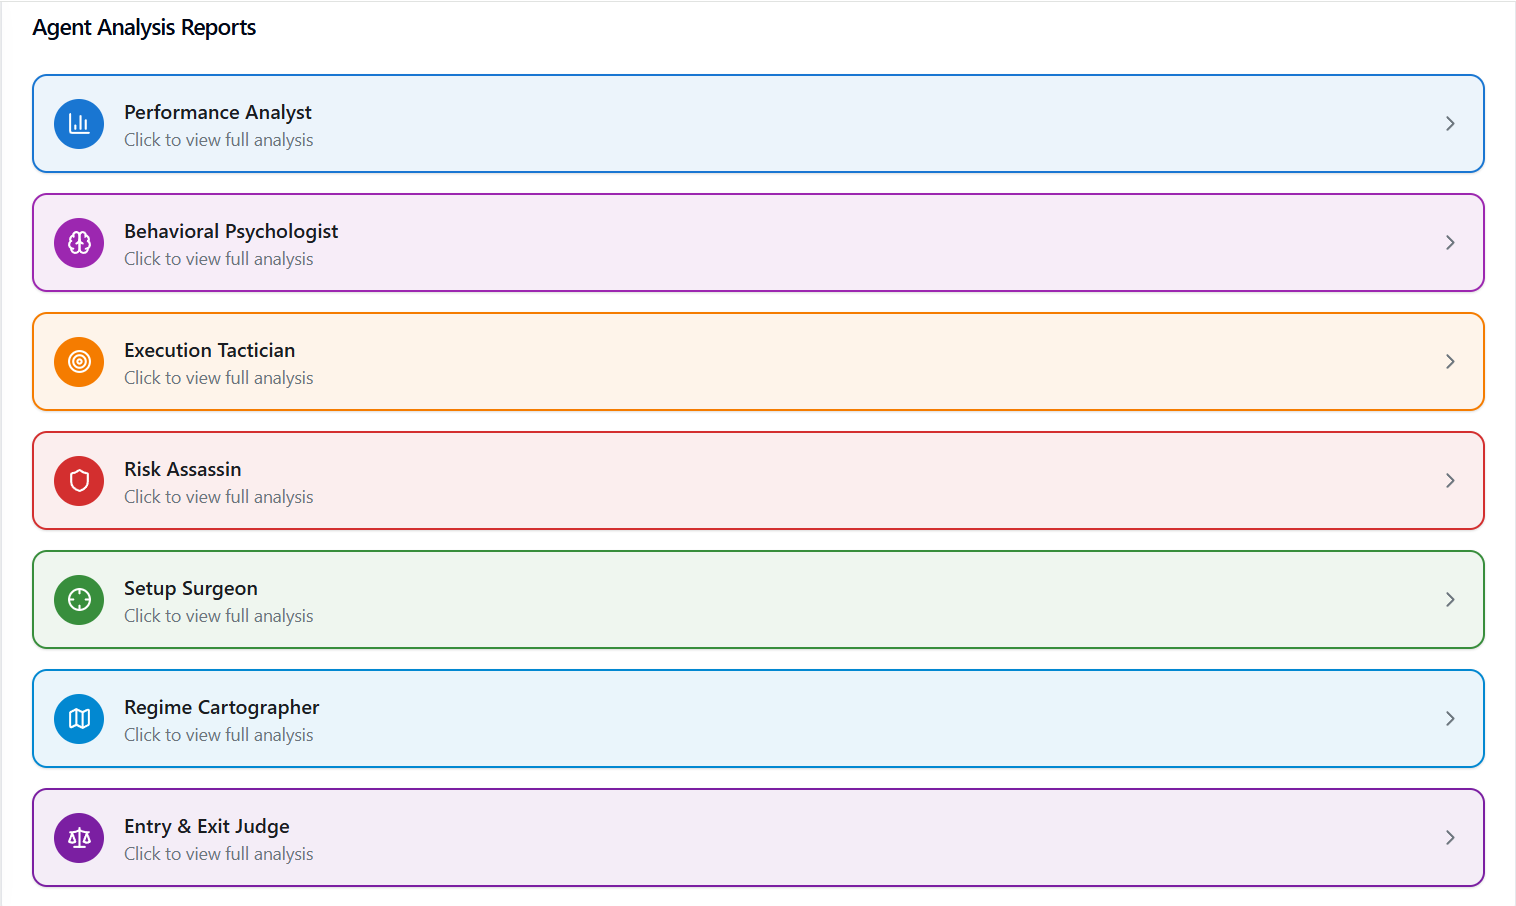
Behavioral Psychologist
Discipline & emotional leakage
Learn more Agent 3Execution Tactician
Timing & fill quality
Learn more Agent 4Risk Assassin
Capital preservation
Learn more Agent 5Setup Surgeon
Setup edge & decay
Learn more Agent 6Regime Cartographer
Market environment fit
Learn more Agent 7Entry & Exit Judge
Opportunity capture forensics
Learn more Agent 8Chief Coaching Officer
Synthesis & prioritization
Learn moreFrequently asked questions
What makes the Performance Analyst different from a PnL chart?
PnL shows outcomes; the Performance Analyst decomposes expectancy, R-multiples, and consistency scores to detect edge decay before headline numbers turn negative. It compares recent vs. older periods on the same canonical tape.
Does it analyze each setup separately?
Yes. Expectancy and R distribution are broken down by setup tags from your Playbook, so you can see which strategies still carry edge and which are statistical noise.
See Performance Analyst on your trade history
Inspect the full AI Council on a populated account — every agent visible, read-only, no credit card.