Cut P&L Variance in 30 Days with Multi Agent Audit for Traders
Reduce wild P&L swings with weekly behavior audits, vol targeting, hard exits, and a multi agent audit workflow. See the first measurable shift within 30...

Cut P&L Variance in 30 Days with Multi Agent Audit for Traders
Variance reduction trading means shrinking the wild swings in your P&L through structured trade auditing, position sizing rules, and execution discipline, not through statistical hedging tricks. The fastest first move is a weekly behavior audit built on a strict journal template. Two numbers tell you it’s working: your rolling P/L volatility drops, and your profit factor climbs.
TL;DR:
- Weekly behavior audits and structured journaling can reduce P&L volatility and improve profit factors within 30 days.
- Position sizing based on volatility targeting automatically adjusts trade sizes, leading to smoother risk profiles during market shifts.
- Fixed exit rules, such as pre-set stop-loss and take-profit levels, are essential to prevent variance from inconsistent execution habits.
- Tracking key KPIs like rolling P&L volatility and profit factor over 30 to 90 trades helps verify discipline and strategy stability.
- Multi-agent trade analysis and structured data collection significantly enhance pinpointing and fixing specific behavioral leaks that cause variance.
Table of Contents
- What Does Variance Reduction Trading Actually Mean?
- Trading Journal and Behavior Audits: The Data Foundation
- Position Sizing and Volatility Targeting
- Exit Rules and Execution Discipline That Cut Variance
- Measuring Progress: The KPIs That Prove Variance Dropped
- How Multi-Agent Trade Forensics Turns Analysis Into Recovered Profits
- Your First 30, 90, and 180 Days
- The Math Behind Variance Reduction (Without the Jargon)
- Variance Reduction Versus Other Risk Management Approaches
- What Variance Reduction Looks Like in Practice
- Software and Tools That Support Variance Reduction Trading
- The Real Limits of Variance Reduction Techniques
- What Discipline Actually Feels Like
- How variance reduction can be operationalized
- Sources
- FAQ
What Does Variance Reduction Trading Actually Mean?
Forget the finance-textbook version of “variance reduction.” In options pricing theory, that phrase refers to Monte Carlo sampling tricks. For a working trader, it means something far more practical: cutting the erratic swings in your equity curve so your results reflect your edge instead of your mistakes.
Three levers drive that outcome, and they work in sequence rather than in isolation.
- Analytics — a structured journal that captures what you actually did, not what you remember doing
- Controls — position sizing rules (volatility targeting, Monte Carlo stress tests) that cap how much any single trade or streak can move your account
- Execution — hard exit rules and order discipline that keep realized results close to planned results
The order matters. Fix your journal before you touch your sizing model. Fix your sizing before you obsess over slippage. A trader who tightens execution while still revenge-trading after losses is polishing the wrong end of the problem. Start with the audit, move to sizing, finish with execution refinement, and let the data tell you when each stage is actually paying off.
Trading Journal and Behavior Audits: The Data Foundation
Most trading journals fail because they record outcomes, not decisions. A journal built for variance reduction needs to capture eight things every single trade, before the outcome is known where possible:
- Setup name and category
- Pre-trade rationale in one sentence
- Invalidation level (the exact price or condition that kills the thesis)
- Planned R (risk unit) and position size
- Emotional state at entry (a simple 1 to 5 scale works)
- Screenshot of the chart at entry
- Actual exit and result in R
- Whether every rule was followed, yes or no
That last field is the one most traders skip, and it’s the one that matters most. A behavior audit built around observable actions rather than self-assessment turns vague guilt (“I traded too emotionally this week”) into a testable fact (“I broke my stop-loss rule on 4 of 11 trades, costing 6.2R”).
Run the post-mortem weekly, and ask four questions every time: What percentage of trades followed every rule? What’s the expectancy on rule-followed trades versus rule-broken trades? What did the broken rules cost in R this week? Is there a recurring failure mode, like adding size after a loss? A 12-field journal paired with a structured post-mortem is enough to compute a discipline score and a conditional expectancy figure within a 30 to 90 day sample.
Pick one behavior control from that list, the single leak costing you the most, and test just that one fix for the next cycle. Trying to fix five habits at once means you’ll never know which change actually moved the needle.
Pro Tip: Tag every trade by time of day and emotional state before you look at outcomes. Patterns hiding in those tags (a 3pm revenge trade streak, a Monday morning overconfidence bias) often explain more variance than the setup itself.

Position Sizing and Volatility Targeting
Bigger positions don’t automatically mean more variance, and smaller ones don’t automatically mean less. Analysis of options positioning found smaller-delta strangles and tighter-wing spreads actually raised P/L volatility relative to the credit received, even though the nominal size looked safer. Risk has to be measured against realized volatility, not against ticket size.
Volatility targeting fixes that blind spot. The formula is simple: position scale equals your target volatility divided by current volatility. When markets get choppy, size shrinks automatically. When they calm down, size expands. This approach smooths realized risk across regimes and typically improves risk-adjusted returns, though it can leave gains on the table during strong, sustained trends.
The lookback window is a real tradeoff:
- Short lookbacks (around 20 days) react fast to changing conditions but add noise
- Longer lookbacks (around 60 days) smooth out noise but lag behind sudden volatility spikes
Statistic to know: a cohort of disciplined journaling traders saw profit factor rise 18.3% over six months, alongside a 4.2 percentage point win rate improvement. Sizing discipline compounds with journal discipline. It doesn’t replace it.
Layer per-trade risk percentage (never more than 1 to 2% of capital per idea) underneath portfolio-level vol targeting, and run Monte Carlo simulations against your strategy’s historical trade distribution to see the range of drawdowns you should actually expect, not just the average case.
Exit Rules and Execution Discipline That Cut Variance
An edge only shows up in your equity curve if execution doesn’t leak it away. Two traders running the identical strategy can post wildly different variance profiles based purely on how they exit.
Build exits around hard invalidation levels set before entry, never adjusted mid-trade based on how the position feels. Pair that with fixed R-multiple stop and target rules: if your plan says 1R stop and 2R target, honoring that ratio across hundreds of trades is what makes expectancy math work at all.
- Set the invalidation level at entry and treat it as immovable
- Use trailing take-profits on trending setups to capture more of the move without guessing the top
- Build in slippage guardrails (limit orders on entries, defined maximum acceptable slippage on exits)
- Log every deviation from the planned exit, even the ones that worked out
Trailing take-profit tactics and disciplined order placement reduce the gap between planned and realized R, and that gap is often where variance quietly builds. A strategy with a genuinely stable edge can still produce a jagged equity curve if execution habits are inconsistent. Fix the habits, and the same edge often produces a visibly smoother curve within a few dozen trades.
Measuring Progress: The KPIs That Prove Variance Dropped
Feelings lie. Numbers usually don’t, provided you’re tracking the right ones and giving them enough sample size to mean something.
- Rolling P/L volatility: standard deviation of daily or weekly P/L over a trailing 20 to 30 trade window
- Profit factor: gross profit divided by gross loss; above 1.5 is generally solid for most retail strategies
- Expectancy: average R gained or lost per trade across your sample
- Max drawdown and duration: peak-to-trough decline and how many trades or days it took to recover
If variance reduction is working, your equity curve should show shorter, shallower drawdowns and a rolling volatility figure trending down over 8 to 12 week windows, even if total returns stay flat or improve modestly. Don’t trust any of these numbers on fewer than 30 trades. Review weekly for behavior metrics, but wait for a full 30 to 90 trade sample before drawing conclusions about a sizing or strategy change.
How Multi-Agent Trade Forensics Turns Analysis Into Recovered Profits
A single reviewer, human or algorithm, tends to anchor on one theory of what’s wrong with your trading. Multi-agent analysis avoids that trap by running several specialist perspectives against the same trade data and forcing them to debate the findings before settling on a recommendation.
Reconstructing trades into structured datasets makes that debate possible in the first place, because you can’t defensibly label a behavior pattern from a messy broker statement. Once trades are structured, issues get ranked by actual dollar impact rather than by how loud they feel. That ranking becomes a prioritized Kill List: the specific, costed leaks to fix first, with an accountability loop that tracks whether the fix actually held over the following weeks. That loop is what turns a one-time insight into a lasting variance reduction.
Your First 30, 90, and 180 Days
- Day 0: Build your journal template, define your setups and their invalidation rules, and set a target portfolio volatility with a chosen lookback window.
- 30 days: Run weekly audits without exception, test exactly one behavior control, and expect to see your first small movement in rolling P/L volatility.
- 90 days: Confirm measurable KPI improvement (profit factor, expectancy) across a sample large enough to trust.
- 180 days: Adjust your playbook based on which setups and controls actually earned their keep, and decide what to scale or retire.
The Math Behind Variance Reduction (Without the Jargon)
You don’t need a statistics degree to use this, but understanding the mechanics helps you trust the numbers instead of second-guessing them every red week.
Variance, in the statistical sense, measures how spread out your trade results are around their average. Standard deviation, the square root of variance, gives you that spread in the same units as your P&L, which is why “rolling P/L volatility” is usually just a rolling standard deviation calculation. A strategy with a 2R average win and results tightly clustered around that number has low variance. The same average with results ranging from minus 5R to plus 9R has high variance, even though the long-run expectancy might be identical.
This is the core insight most traders miss: two strategies can have the exact same expectancy and produce completely different psychological and financial experiences, because one has a smooth path to that expectancy and the other has a jagged one. Volatility targeting works mathematically because it inversely scales exposure to recent realized volatility, which mechanically compresses the width of your return distribution without necessarily changing its center.
Sample size does the rest of the heavy lifting. Small samples (10 to 20 trades) show enormous apparent variance even in a genuinely stable system, purely from statistical noise. That’s why every KPI section in this guide keeps repeating the same threshold: 30 trades minimum, 90 to 180 for real confidence. Confusing noise for a system failure, or a lucky streak for a breakthrough, is the single most expensive misread in the math.
Variance Reduction Versus Other Risk Management Approaches
Traditional risk management tends to focus on a handful of blunt instruments: fixed stop-losses, maximum position limits, and diversification across uncorrelated assets or strategies. Those tools still matter, but they treat every trade as a static risk event instead of asking whether the trader’s own behavior is inflating the risk beyond what the strategy itself requires.
Diversification lowers portfolio variance by spreading exposure across assets that don’t move together, and it remains one of the most reliable tools available. Hedging, using options or offsetting positions to cap downside, reduces variance at the cost of some upside, similar to the tradeoff seen in volatility targeting. Both approaches manage variance from the outside, adjusting what you’re exposed to.
Variance reduction trading, in the practitioner sense used throughout this guide, works from the inside out. It starts with the assumption that a meaningful chunk of a trader’s variance isn’t market risk at all. It’s inconsistent execution of a perfectly reasonable strategy. A trader with a stop-loss discipline problem doesn’t need a different asset allocation; they need a behavior audit. A team with inconsistent sizing across desks then need more hedges; they need a shared vol-targeting framework and a review process that catches deviations early.
The strongest setups combine both. Use diversification and hedging to manage market-structure risk you can’t control, and use journaling, sizing rules, and execution audits to manage the behavioral risk you absolutely can control. Treating either approach as a complete substitute for the other leaves money on the table.
What Variance Reduction Looks Like in Practice
Consider a swing trader running a mean-reversion strategy with a solid historical edge but a wildly inconsistent monthly P&L. Some months post strong gains, others give most of it back. The strategy’s expectancy hasn’t changed; the trader’s execution consistency has.
A behavior audit run over several weeks typically surfaces the same handful of patterns: rules followed cleanly on winning streaks, rules broken after two or three consecutive losses (moving stops, doubling size to “make it back,” or skipping the pre-trade checklist entirely). That gap between rule-followed expectancy and rule-broken expectancy is usually the single largest source of variance in an otherwise sound strategy.
The fix rarely involves changing the strategy at all. It usually means adding one hard constraint, like a mandatory 24-hour pause after two consecutive losing trades, and tracking adherence to that single rule for the next full cycle. Traders who isolate one control at a time, rather than overhauling their whole process after a rough week, tend to see the clearest signal in their KPIs because they know exactly which variable changed.
Team trading desks face a scaled-up version of the same problem: five traders running similar strategies but wildly different sizing discipline. A shared journal template and a weekly cross-desk review, comparing discipline scores and conditional expectancy side by side, tends to surface the outlier faster than any individual manager’s intuition would.
Software and Tools That Support Variance Reduction Trading
You can run a basic version of this entirely on a spreadsheet: journal fields in columns, a weekly pivot table for the post-mortem, and a manual volatility calculation. Plenty of disciplined traders got their start that way, and there’s no shame in it for a small account.
The limits show up fast once you’re tracking multiple setups, multiple traders, or want Monte Carlo simulations run against your actual trade distribution instead of a textbook normal curve. Purpose-built trade review software automates the reconstruction of raw broker data into the structured fields a real audit needs, which removes the manual entry errors that quietly corrupt spreadsheet journals over time.
Look for four capabilities specifically: automated trade reconstruction from broker exports, behavior tagging that doesn’t rely purely on self-report, R-multiple framing instead of raw dollar P&L (so results compare cleanly across position sizes), and simulation tools that model drawdown ranges rather than single-point estimates. Team-focused platforms add a shared workspace or live blotter, which matters once more than one person’s decisions are feeding the same P&L.

Whatever tool you pick, the tool itself doesn’t reduce variance. The weekly discipline of actually reviewing what it shows you does.
The Real Limits of Variance Reduction Techniques
None of this eliminates risk, and treating it that way is how traders get hurt. Volatility targeting smooths the ride but can meaningfully underperform in a strong, sustained trend, because it’s mechanically reducing exposure right when a trend-following approach would want more. That’s a real cost, not a footnote.
Behavior audits are only as good as the honesty behind the inputs. A trader who fudges the “rules followed” field to avoid an uncomfortable weekly review has built a system that measures nothing. Journaling fatigue is a genuine risk too: the discipline required to log every trade accurately, every week, for months, is nontrivial, and abandoning it halfway through a sample invalidates the data collected so far.
There’s also an overfitting trap specific to this method. Testing one behavior control at a time is the right approach, but it’s tempting to keep adjusting rules every week based on small-sample noise rather than genuine signal. Thirty trades of “improvement” after a rule change can easily be variance, not causation. Wait for the fuller sample before declaring victory or scrapping a fix.
Finally, sizing math like vol-targeting and Monte Carlo simulation assumes your historical trade distribution is a reasonable guide to the future. Regime changes (a strategy that thrived in low-volatility markets suddenly facing a volatility spike) can break that assumption fast. Treat every model here as a decision aid, not a guarantee, and keep a human review layer on top of the numbers.
What Discipline Actually Feels Like
Expect the first few weeks of KPI tracking to feel noisy and occasionally discouraging. That’s normal, not a sign your process is broken. The temptation to tweak three things at once after one rough week is strong, and it’s exactly what erases your ability to know what worked. Accountability and single-control testing are the antidote to that overfitting instinct, not a slower path around it.
— DigitalPunk
How variance reduction can be operationalized
A multi-agent audit that brings together several specialist analysts and a coordinating officer can debate trade data openly instead of handing you a single generic score. Structured journals, Monte Carlo sizing, and a prioritized Kill List with financial impact quantified can be built into the workflow, so you’re not stitching together a spreadsheet and a separate simulation tool.
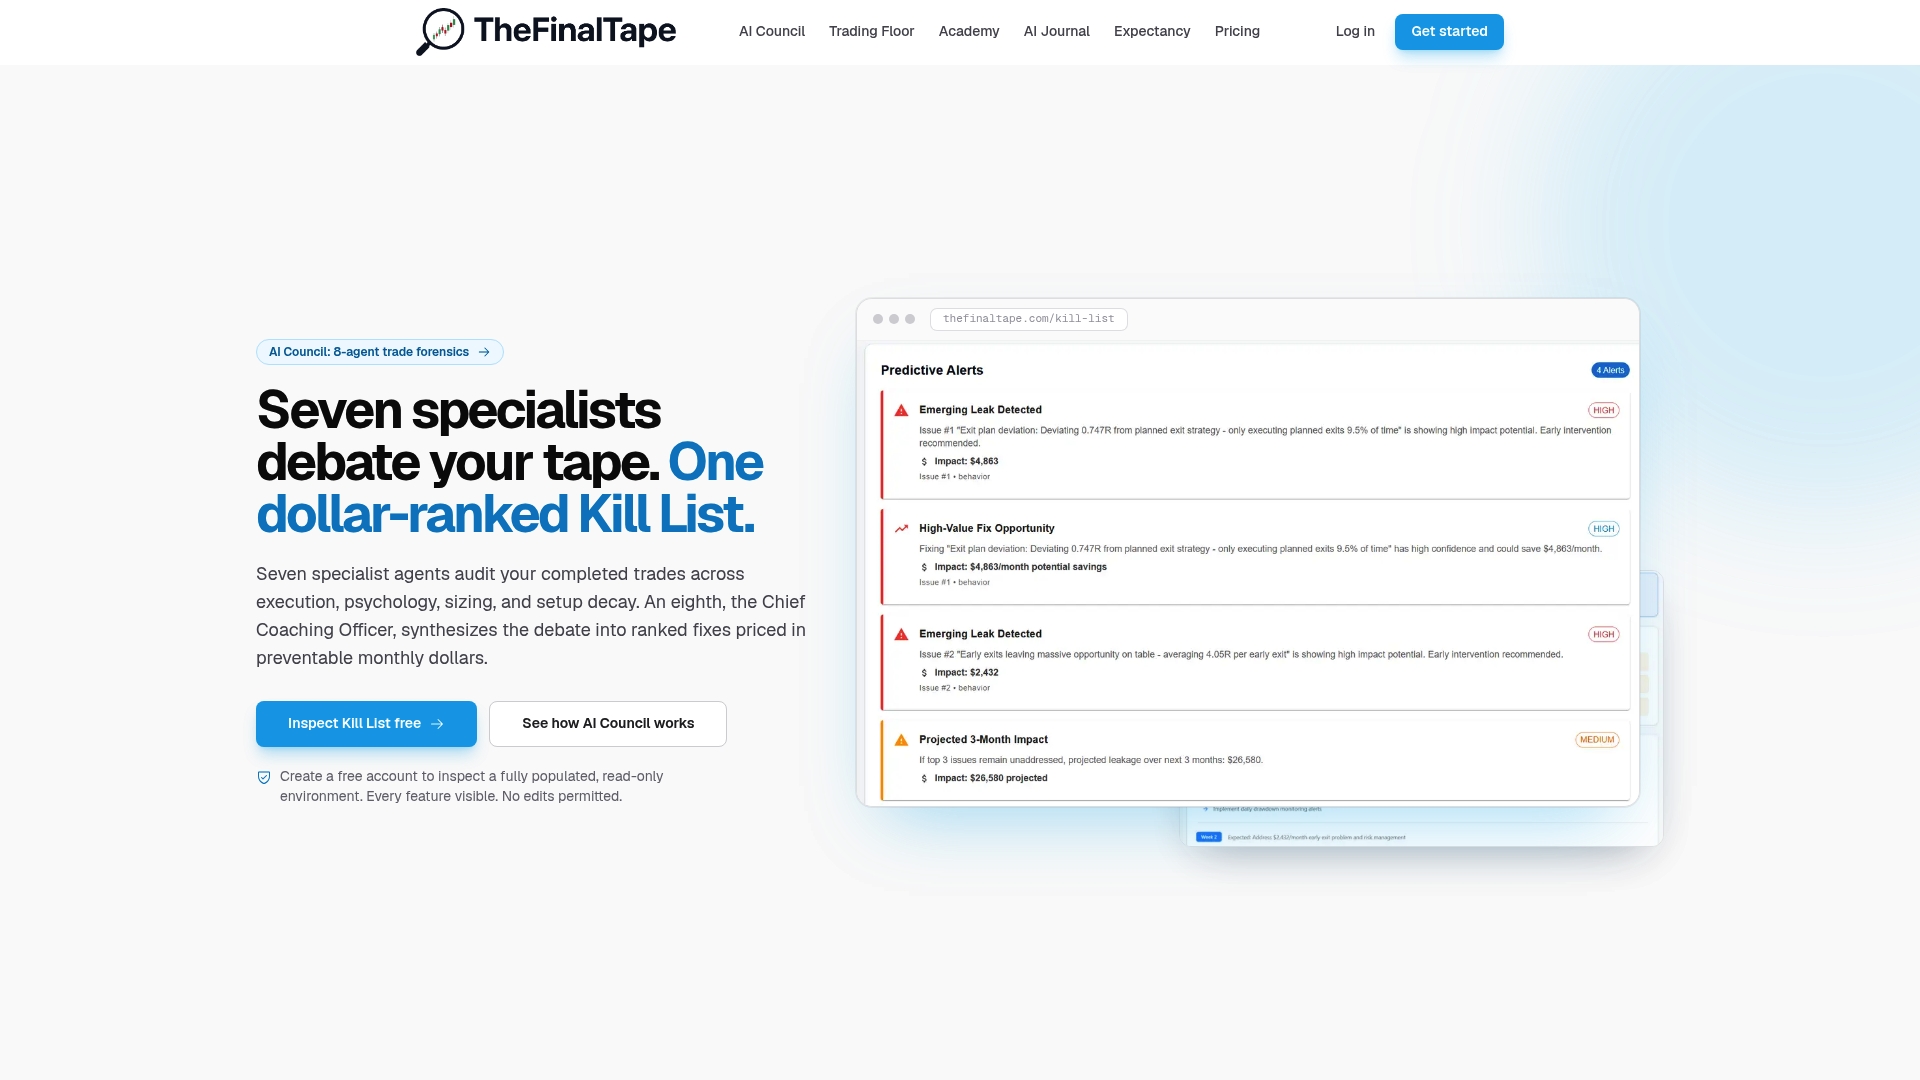
Start in the free read-only environment to see how the platform structures trade data before committing anything. Upload a sample week once you’re ready, and let the AI Council review your performance the way this guide describes: behavior labels first, ranked leaks second, one accountability loop to test the fix. If you want to see exactly what that review surfaces, explore the trading journal and analytics solutions and get your first Kill List built from your own trades.
Sources
- Understanding P&L volatility in trading
- The Behavior Audit: Review Trades by Action, Not Opinion
- The trading journal and post-mortem template we actually use
- Volatility targeting explained — Keep portfolio risk steady across regimes
- Elev8 study: Journaling traders boost profit factor 18% in six months
FAQ
What Is Variance Reduction Trading?
It’s the practice of lowering the volatility of your P&L through structured journaling, behavior audits, disciplined position sizing, and consistent execution rather than through statistical hedging techniques.
How Long Before I See Results From a Behavior Audit?
Most traders see the first measurable shift in rolling P/L volatility within 30 days of consistent weekly audits, though a full 90 to 180 day sample is needed to trust the KPI movement.
What’s the Difference Between Volatility Targeting and Fixed Risk-Percent Sizing?
Fixed risk-percent caps the loss on any single trade at a set fraction of capital, while volatility targeting scales your entire portfolio’s exposure inversely to recent realized volatility, smoothing risk across changing market regimes.
Can Journaling Alone Improve My Profit Factor?
Disciplined journaling has been linked to an 18.3% average profit factor improvement over six months in one cohort study, alongside reduced overtrading.
Does Thefinaltape Replace My Broker’s Reporting Tools?
No. Thefinaltape reconstructs your trade data into structured datasets for multi-agent forensic analysis, which goes well beyond the basic P&L summaries most broker platforms provide.
Recommended
Stop reviewing from memory
Run compliance scoring, tag ranking, and Kill List rules on every trade — not once a month when the account feels off.