6 Trailing Stop Methods Traders Use: Regime First Rules to Pick One
Learn when to use each of the six trailing stop families, set activation and size by timeframe, and audit exits to see what helped or hurt.

6 Trailing Stop Methods Traders Use: Regime First Rules to Pick One
A trailing stop is an order that moves in your favor as a trade gains ground and locks in place the moment price turns against you. Traders pick from six main families: percent/dollar trails, ATR and chandelier trails, structure or Donchian trails, moving-average trails, Parabolic SAR, and profit-lock ratchets. The practical rule is simple: match the family to the market’s behavior and your timeframe. ATR-based trails suit active, multi-market strategies; structure-based trails suit discretionary swing trades where price action tells the real story.
TL;DR:
- ATR-based trailing stops are most effective when using multipliers between 1.5× and 3×, depending on volatility and trading style.
- Structure and Donchian trails suit discretionary and systematic trend-following strategies, respectively, with parameters like 10 or 20 bars being common.
- Always confirm a trend regime before activating any trailing stop and wait for a profit cushion to avoid premature exits from market noise.
- Verify your broker’s trailing implementation type—tick-based or bar-close—and whether stops are server- or client-side to prevent unexpected gaps.
- Backtest and audit your trailing methods regularly to identify and correct common mistakes such as moving stops to breakeven too early or using unsuitable timeframes.
Table of Contents
- What Trailing Stop Methods Actually Do
- How Do ATR and Chandelier Trailing Stops Work?
- Structure-Based and Moving-Average Trails
- Parabolic SAR and Profit-Lock Ratchets
- How to Choose a Trailing Stop Method and Set Parameters
- Common Mistakes That Sabotage Trailing Stops
- Worked Examples: How Trailing Stops Ratchet in Practice
- Platform Checks Before You Rely on Automated Trailing
- What Trade Audits Reveal About Your Trailing Choices
- Audit Your Exits Before You Trust the Next Trail
- Sources
- FAQ
What Trailing Stop Methods Actually Do
Every trailing stop shares the same skeleton. It ratchets only in one direction. When your trade moves in your favor, the stop tightens toward price. When price reverses against you, the stop holds its ground and triggers an exit if breached. That asymmetry is the entire point: a trailing stop only moves in the direction that protects profit, never backward, and once it fires, most platforms route it as a market order unless you’ve specified a stop-limit variant.
The methods differ across three axes: what they anchor to, how often they update, and how aggressively they tighten. A percent trail anchors to your entry or peak price. An ATR trail anchors to volatility. A structure trail anchors to price action itself, like a swing low. Understanding those axes matters more than memorizing formulas, because it tells you which method will behave the way you expect in the market you’re actually trading.
Here’s the quick reference for the major families:
- Percent/dollar trail: Stop sits a fixed percent or dollar amount below the highest price reached. Simple, but blind to volatility.
- ATR/chandelier trail: Stop sits a multiple of Average True Range below the highest high. Adapts to volatility automatically.
- Structure/Donchian trail: Stop moves beneath the most recent confirmed swing low or N-bar low. Respects price action, not math.
- Moving-average trail: Stop exits when price closes beyond a chosen moving average. Slower, trend-following logic.
- Parabolic SAR: Stop accelerates as the trend extends, tightening faster the longer the move runs.
- Profit-lock ratchet: Stop jumps to breakeven or a fixed profit level at preset milestones, then may switch to another trailing method.
Trailing stops are commonly grouped this way by practitioners, and picking the right family for the regime you’re trading matters more than fine-tuning any single parameter inside it.
How Do ATR and Chandelier Trailing Stops Work?
The ATR trail is the workhorse of volatility-based exits, and the chandelier exit is its most popular variant. Both use Average True Range, a measure of how much an instrument typically moves in a given period, to set a stop distance that expands and contracts with market conditions instead of staying fixed.
The formulas:
- ATR trail:
Stop = Highest Close (or High) since entry − (k × ATR). As the high extends, the stop ratchets up. If price never makes a new high, the stop stays put. - Chandelier exit:
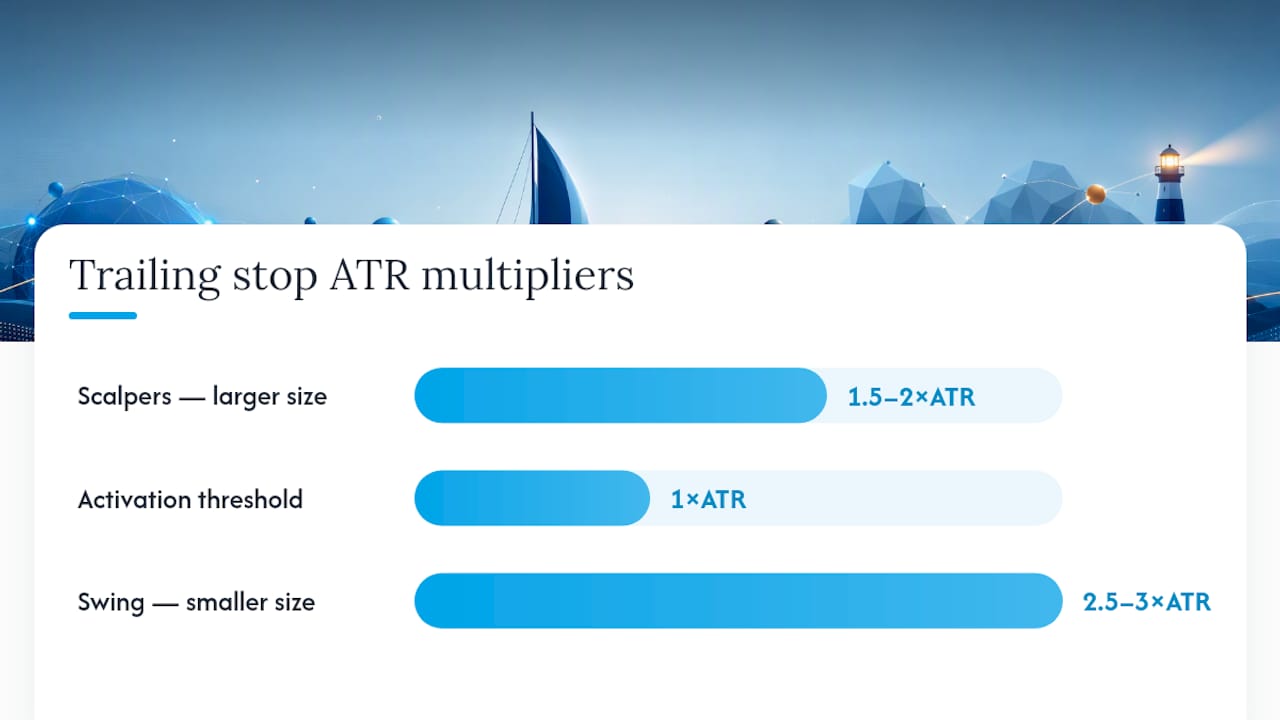
Stop = Highest High over N bars − (k × ATR). The classic setup uses a 22-bar lookback with k = 3, a combination commonly cited as a starting benchmark among trend-following traders. - Multiplier selection: Tighter multipliers (1.5×–2×) suit shorter timeframes and mean-reverting names. Wider multipliers (2.5×–3×) suit swing and position trades on trending instruments.
Statistic Callout: ATR multipliers between roughly 1.5× and 3× cover most of the practical range traders use across timeframes and instruments, with the choice driven by how much noise you’re willing to tolerate before the trail cuts you out.
A common refinement is delaying activation. Waiting until the trade has moved at least one ATR in your favor before switching on the trail keeps the stop from getting clipped during the entry’s initial noise. One execution wrinkle worth knowing: some platforms recalculate the ATR trail on every tick, others only on bar close. A tick-based trail reacts faster but whipsaws more; a bar-close trail is calmer but slower to lock in gains.
Structure-Based and Moving-Average Trails
Structure-based trails ignore volatility math entirely and follow price action instead. A confirmed swing low forms when a candle’s low sits below both the candle before it and the candle after it. Once confirmed, you move your stop just beneath that swing low, then repeat the process as each new higher low prints. It’s manual, but it respects the actual chart rather than an abstract formula.
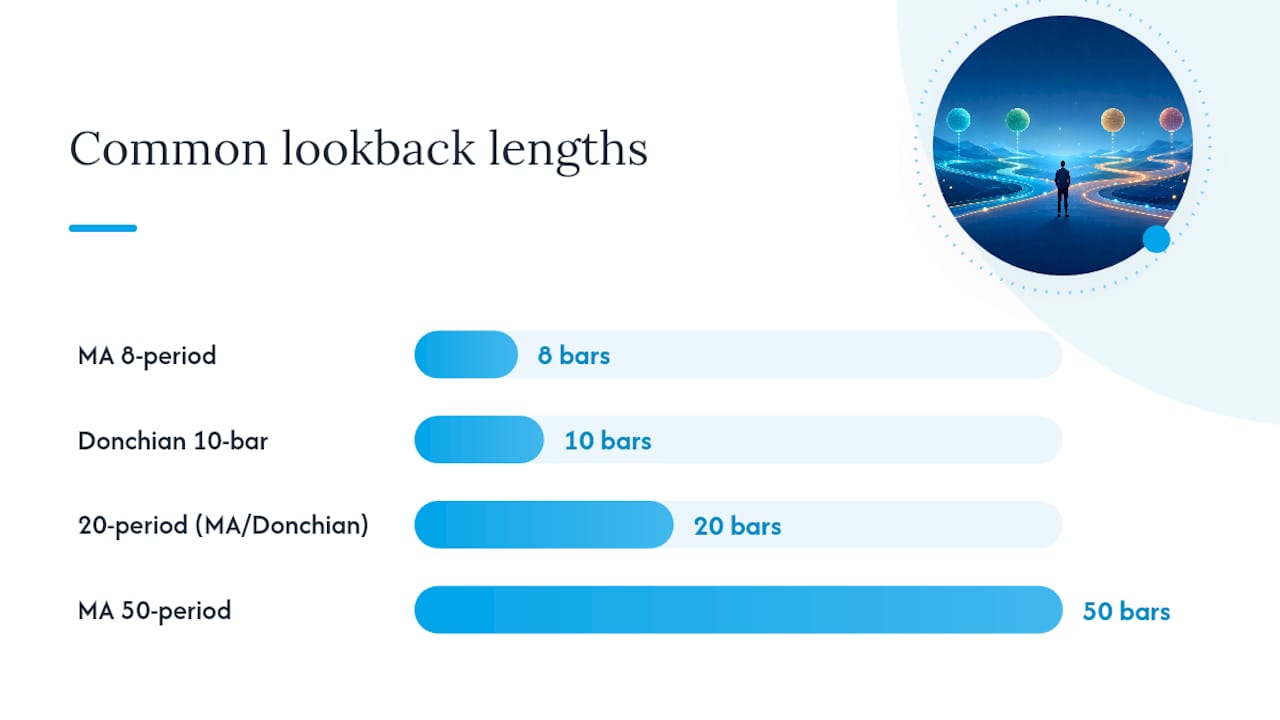
Donchian trails automate a version of this. The rule sets your stop at the lowest low of the past N bars, most commonly 10 or 20, echoing the original Turtle trading rules. A 20-bar Donchian trail is more forgiving on trending swing trades; a 10-bar version reacts faster but exits more trades prematurely in choppy conditions.
Moving-average trails exit when price closes beyond a chosen average, commonly the 8, 20, or 50-period MA depending on your holding period. Day traders lean on the 8 or 20; swing and position traders often use the 50. The key detail: use a close beyond the average as the trigger, not a wick touch, or you’ll get stopped out by ordinary intraday noise.
- Swing-low trails fit discretionary trend trades where you’re reading structure candle by candle.
- Donchian trails fit systematic strategies that need a rule a computer can execute without judgment calls.
- MA trails fit trend-following setups where you’re willing to give back more profit in exchange for staying in bigger moves.
Pro Tip: Combine a structural stop with a trailing method: keep your initial stop below the last swing low until the trade clears a profit threshold, then hand off to your trailing rule. It keeps you from tightening the leash before the trade has proven itself.
Parabolic SAR and Profit-Lock Ratchets
Parabolic SAR, short for “stop and reverse,” is the one trailing method that accelerates on its own. As a trend extends and makes new highs, the SAR’s acceleration factor increases, pulling the stop closer to price with each new bar. It’s built for trending markets and performs poorly in sideways conditions, where it flips direction repeatedly and racks up small losses.
Profit-lock ratchets work differently. Instead of continuous adjustment, they jump the stop to specific levels at preset milestones: breakeven at 1R, half the open profit at 2R, and so on. The appeal is obvious. Nobody wants to give back a winning trade. The statistical cost is less obvious, and it’s real: moving a stop to breakeven too early routinely cuts into long-term expectancy because it scratches trades that would have recovered and gone on to hit target. You’re not eliminating losses, you’re converting a portion of your winners into scratches.
- Parabolic SAR fits strong, established trends where you want the stop to accelerate as conviction builds.
- Breakeven-at-1R ratchets feel safe but often reduce net expectancy across a large enough sample of trades.
- Stop-and-reverse logic (flipping short to long on a SAR cross) works best on trending instruments and poorly on range-bound ones, where the whipsaw cost adds up fast.
The honest takeaway: SAR and profit-lock ratchets both trade some upside for peace of mind. That’s a legitimate choice, but only if you’ve measured what it costs you.
How to Choose a Trailing Stop Method and Set Parameters
Start with the regime, not the indicator. A trailing stop assumes the market is trending in your favor; deploying one in a range-bound, choppy market guarantees a string of small, needless losses as price oscillates around your entry. Confirm you’re in a directional move before you bother trailing anything. Reviewing a rules-first trend-following framework is a useful gut check before you commit to any single trailing family.
- Identify the regime. Use higher-timeframe structure or a simple trend filter to confirm direction before activating any trail.
- Map the family to your timeframe. Scalpers and day traders typically use 1.5×–2× ATR or 8/20-period MA trails; swing traders lean toward 2.5×–3× ATR, 20-bar Donchian, or 50-period MA trails.
- Set the activation threshold. Don’t trail from bar one. Wait until the position clears roughly 1×ATR or 0.5R–1R of open profit before the trail engages, so you’re not giving the trade room to breathe and then choking it immediately.
- Size your position around the trail distance. A wider ATR multiplier means a wider eventual stop, which should shrink your position size to keep total risk consistent. The Kelly Criterion framework is worth reviewing here, since trail distance and position size are really the same risk decision viewed from two angles.
- Test before you trust it. Backtest the method across at least a full market cycle, then paper trade it live before committing size. Parameters that looked great on a six-month trending sample often fall apart in a choppy quarter.
Pro Tip: Run the same trade through two trailing methods on paper, side by side, for a month. Most traders discover their “gut feel” trail underperforms a boring, mechanical ATR trail by a wider margin than they expected.
Position sizing deserves one more word here. A trail that’s too tight relative to your size invites death by a thousand cuts; a trail that’s too wide relative to your size means one bad trade does outsized damage. The two decisions aren’t separable, and treating them as separate is one of the more common structural errors in retail risk management.
Common Mistakes That Sabotage Trailing Stops
The single most expensive mistake is moving the stop to breakeven the moment a trade shows a little green. It feels responsible. It’s often statistically costly, since scratching trades that would have recovered quietly erodes expectancy over a large sample of setups.
- Breakeven-too-early: Wait for a real profit cushion, not just a green candle, before ratcheting to breakeven.
- Wrong timeframe, wrong trail: A 5-minute ATR trail bolted onto a multi-day swing trade will chop you to death; match the lookback period to your holding period.
- Trail too tight for the instrument’s noise: Check the instrument’s typical ATR before setting a multiplier, not after getting stopped out.
- Client-side trailing gaps: Some brokers only advance the trail while your platform is open and connected, which is a real risk if you close your laptop mid-trade.
Pro Tip: Before trusting any automated trail, ask your broker directly whether it’s server-side or client-side. It’s a five-minute question that can save you a very bad week.
Auditing your own exits after the fact, not just your entries, is the fastest way to catch which of these mistakes you’re actually making versus which ones you only think you’re making.
Worked Examples: How Trailing Stops Ratchet in Practice
Numbers make this concrete. Say you buy a stock at $100.
- Percent trail (5%): Price rises to $110, so the stop moves to $104.50 (5% below the peak). Price pulls back to $106, the stop holds at $104.50. Price climbs to $120, the stop ratchets to $114. A reversal to $114 triggers the exit, banking a $14 gain.
- ATR/chandelier trail (k=3, ATR=$2): Stop starts at Highest High − $6. If the highest high is $115, the stop sits at $109. As the highest high extends to $122, the stop ratchets to $116. tightening automatically as volatility and price both move.
- Structure trail: Entry at $100 with a swing low at $97. Price rallies to $108, prints a new swing low at $103; the stop moves to just under $103. Price extends to $116 with a swing low at $111; the stop moves to $110.50.
Statistic Callout: ATR multipliers of roughly 1.5× to 3× are the range most traders operate in across these examples, meaning the same $2 ATR could justify a $3 stop distance or a $6 one depending on your chosen k value.
One execution note across all three: a standard trailing stop fills at the market once triggered, while a trailing stop-limit only fills at your specified limit price or better, which can leave you unfilled entirely during a fast gap.
Platform Checks Before You Rely on Automated Trailing
Verify your broker’s trailing behavior before you trust it with real capital. Trailing implementations vary meaningfully across brokers: some update tick-by-tick, others only recalculate on bar close, and either can produce very different exit prices in a fast-moving session.
- Confirm whether trailing runs server-side (works even if your platform is closed) or client-side (requires your terminal running).
- Understand the difference between a trailing stop, which fills at market once triggered, and a trailing stop-limit, which can miss fills during gaps.
- Ask how the broker handles illiquid or off-exchange prints, since a stray print can trigger a stop that shouldn’t have fired.
What Trade Audits Reveal About Your Trailing Choices
Trade forensics expose the gap between the trailing method you think you’re using and the one your exits actually reflect. Reconstructing trades into structured data surfaces the recurring pattern: moving to breakeven too soon, trailing on the wrong timeframe, or letting client-side gaps clip winners. The Final Tape’s AI Council and Kill List approach turns that pattern into a ranked, quantified list. Log the trade, measure the exit, then iterate the rule.
— DigitalPunk
Audit Your Exits Before You Trust the Next Trail
Backtesting tells you what a trailing method should have done. Your actual trade history tells you what it did, and those two numbers diverge more often than most traders admit. This type of platform reconstructs your closed trades into structured data and runs them through an AI Council that ranks your recurring exit errors by dollar impact, not gut feeling.

If breakeven-too-early or a mistimed ATR multiplier has been quietly draining your account, a forensic trade review will show you exactly where and by how much. Traders who want the walkthrough first can start with Lesson 36 on trade management to see how exit rules get scored inside the platform. From there, run your last 20 to 30 trades through the AI Council and get a prioritized Kill List of exactly which trailing habits to fix first.
Sources
FAQ
What is the best way to set a trailing stop loss percentage?
There’s no single best percentage; it depends on the instrument’s typical volatility and your timeframe.
Is a trailing stop loss a good idea?
Trailing stops are useful in trending markets because they lock in gains automatically without forcing you to manually adjust every stop. They perform poorly in choppy, range-bound conditions, where the constant ratcheting can trigger premature exits.
What are common mistakes with trailing stops?
The biggest mistake is moving the stop to breakeven too early, which can scratch trades that would have recovered. Others include mismatching the trail’s timeframe to your holding period and not confirming whether your broker trails on a server-side or client-side basis.
What is a reasonable trailing stop distance?
For ATR-based trails, a multiplier between 1.5× and 3× ATR covers most practical cases depending on timeframe and instrument volatility. For structure-based trails, a confirmed swing low or a 10 to 20-bar Donchian low is a reasonable, widely used benchmark.
Recommended
Stop reviewing from memory
Run compliance scoring, tag ranking, and Kill List rules on every trade — not once a month when the account feels off.