5 Trading Metrics Traders Must Track and Prioritize by Dollar Impact
Learn the five trading metrics to track, how to calculate them net of costs, and how to rank fixes by expected dollar leak and feasibility.

5 Trading Metrics Traders Must Track and Prioritize by Dollar Impact
Track five numbers before anything else: expectancy, profit factor, maximum drawdown, cost-adjusted net P&L, and one risk-adjusted ratio like Sharpe or Sortino. Every one of them must be calculated net of commissions, fees, and slippage, over a defined sample of trades, not cherry-picked weeks. Skip that discipline and every downstream number lies to you. Start by exporting your last 30 to 50 trades and calculating expectancy first. It’s the single fastest read on whether your strategy has a real edge.
TL;DR:
- Calculating expectancy over at least 30 to 50 trades, including all costs and slippage, provides the most reliable indicator of a strategy’s profitability.
- Maximum drawdown duration and recovery requirements significantly impact whether a strategy can survive testing, making the Calmar ratio a helpful comparison tool.
- Risk ratios like Sharpe, Sortino, and information ratio must be paired with drawdown measures, as they can be misleading if used alone or with skewed distributions.
- Analyzing trade patterns by session, setup, and time frame requires sufficient data and out-of-sample testing to identify meaningful edges instead of noise.
- Forensic trade analysis, combined with a prioritized fix list based on dollar impact, offers the clearest path to measurable performance improvement.
Table of Contents
- What Trading Performance Metrics Should You Track First?
- How Do Risk Metrics Reveal If Your Strategy Can Survive?
- When Should You Use Sharpe vs. Sortino vs. Information Ratio?
- Why Do Costs Quietly Destroy Your Real Performance?
- Do Time-of-Day and Setup Patterns Reveal a Real Edge?
- How Should You Track Time-Weighted and Money-Weighted Returns?
- Why Does Looking at One Metric Always Lead You Astray?
- What Concrete Actions Improve Measurable Trading Performance?
- How Does Forensic Trade Analysis Turn Metrics Into Fixes?
- How Do Psychological Biases Distort the Metrics You Trust?
- How Do You Benchmark Trading Performance Against the Market?
- Why Traders Fool Themselves With Their Own Numbers
- Turn Your Trade Log Into a Prioritized Action Plan
- Where to Verify These Formulas and Standards
- Sources
- FAQ
What Trading Performance Metrics Should You Track First?
Most traders start by counting wins. That’s backwards. Win rate tells you how often you’re right, but it says nothing about how much you make when you’re right versus how much you lose when you’re wrong.
Profit factor fixes part of that blind spot. It’s gross profit divided by gross loss. A profit factor above 1 indicates more profit than loss, which is generally desirable. Anything under 1.0 means the strategy is a net loser before you even touch costs. Professional desks generally prefer profit factors well above 1 before scaling a strategy with additional capital.
Expectancy is the number that actually answers “does this system make money.” The formula: (win rate × average win) minus (loss rate × average loss). Run it in dollars, not percentages, because dollar expectancy tells you what one trade is statistically worth to your account.
Here’s a worked example. Say you took 40 trades last month: 18 winners averaging $220, and 22 losers averaging $140.
- Win rate: 18/40 = 45%
- Average win: $220, average loss: $140
- Expectancy = (0.45 × $220) − (0.55 × $140) = $99 − $77 = $22 per trade
That $22 is your edge, and it only counts if it already reflects fees and slippage. Partial exits complicate the math further. When you scale out of a position in two or three fills, treat each fill as its own trade line in your log rather than averaging them into one entry. It’s tedious, but it’s the only way profit factor and expectancy stay accurate.
How Do Risk Metrics Reveal If Your Strategy Can Survive?
Win rate and profit factor tell you if a strategy makes money on paper. Maximum drawdown (MDD) tells you if you can survive the ride long enough to collect it. MDD measures the largest peak-to-trough decline in your account, expressed as a percentage or dollar figure.
Drawdown percentage alone is incomplete. A 20% drawdown that resolves in three weeks is a different animal from a 20% drawdown that drags on for eight months. Drawdown duration, how long you stayed underwater before hitting a new equity high, matters as much as the depth. CFA Institute research on portfolio construction notes that drawdown distributions and Conditional Drawdown at Risk (CDaR) give more predictive power than a single worst-case MDD figure, since CDaR captures the average of the worst drawdown episodes rather than just the single deepest one.
The recovery math gets brutal fast:
- A 10% drawdown needs an 11.1% gain to recover.
- A 25% drawdown needs a 33.3% gain to recover.
- A 50% drawdown needs a 100% gain, doubling your remaining capital just to break even.
That asymmetry is why Calmar ratio (annualized return divided by maximum drawdown) matters for comparing strategies with different risk profiles. A strategy returning 20% annually with a 10% max drawdown (Calmar of 2.0) is objectively more survivable than one returning 30% with a 40% drawdown (Calmar of 0.75), even though the second looks flashier on a headline return chart.
Position sizing should trace directly back to your drawdown tolerance. If you can’t stomach watching 15% of your account evaporate, your position sizes need to be small enough that your historical worst-case drawdown stays under that threshold.

When Should You Use Sharpe vs. Sortino vs. Information Ratio?
Risk-adjusted metrics answer a different question than raw returns: how much risk did you take to get that return? Each of the three main ratios answers it from a different angle.
- Sharpe ratio divides excess return (return minus the risk-free rate) by the standard deviation of returns. It’s the most widely cited risk-adjusted metric, but it’s frequency-dependent. Calculate it from daily returns versus monthly returns and you’ll get materially different numbers. Sharpe also assumes returns are normally distributed, an assumption that breaks down for strategies with serial correlation or fat-tailed outcomes, according to Stanford’s William Sharpe, who originated the ratio.
- Sortino ratio only penalizes downside volatility, ignoring upside swings that Sharpe treats as “risk.” That makes Sortino more decision-relevant for traders who care about drawdown pain, not total variance. The catch: you must use the same minimum acceptable return (MAR) across strategies you’re comparing, or the numbers aren’t comparable at all, per CFA Institute’s Sortino ratio documentation.
- Information ratio measures excess return over a benchmark divided by tracking error, useful when you’re trying to isolate skill versus market beta. Pair it with R² to confirm the benchmark you chose is actually relevant to your strategy’s behavior.
None of these ratios should be read alone. CFA materials on Sharpe and information ratio usage warn that both can be distorted by non-normal return distributions, so pair them with a drawdown check before trusting the headline number.
Why Do Costs Quietly Destroy Your Real Performance?
A strategy that looks profitable gross of costs can be a net loser once you account for what it actually costs to execute it. Turnover, how frequently you buy and sell relative to account size, drives commissions, spreads, and often tax consequences directly.
SEC fund disclosures make this concrete: filings show that higher portfolio turnover can materially increase transaction costs and reduce realized returns, which is exactly why fund documents are required to flag turnover ratios for investors. The same math applies to your personal account, just without a compliance department forcing you to disclose it to yourself.
Slippage is the gap between your intended execution price and your actual fill. Estimate it by comparing your limit price or signal price against your logged fill price, trade by trade, then average the gap over a rolling sample.
- Track realized slippage per trade, not as a blanket assumption.
- Separate commissions from spread cost from slippage in your log.
- Rebuild your backtest assumptions using your actual live slippage, not the backtest’s default estimate.
High turnover strategies can look profitable gross of costs but turn money-losing once realistic transaction costs and tax treatment are applied.
Do Time-of-Day and Setup Patterns Reveal a Real Edge?
Segmenting your trade log by session, weekday, and setup tag often exposes patterns you’d never catch by staring at one aggregate equity curve. Maybe your morning session trades carry a 1.8 profit factor while afternoon trades hover near 1.0. Maybe your breakout setups outperform your mean-reversion setups by a wide margin.
The trap is treating every pattern you find as real. Test enough slices of your data and you’ll find “edges” that are pure noise, a classic multiple-testing problem. A weekday effect built on 12 trades isn’t a pattern; it’s a coin flip that happened to land on heads a few extra times.
- Require a minimum of 30 to 50 trades per segment before drawing conclusions.
- Re-test any apparent edge on a fresh, out-of-sample period before acting on it.
- Treat a temporal edge as durable only when it persists across at least two separate time windows.
How Should You Track Time-Weighted and Money-Weighted Returns?
Time-weighted return (TWR) measures the performance of your strategy independent of when you added or withdrew capital. Money-weighted return (MWR), essentially an internal rate of return, factors in the timing and size of your cash flows. If you deposited extra capital right before a strong month, MWR will flatter your results in a way TWR won’t. Use TWR to judge strategy skill; use MWR to judge how your actual account grew.
Regulatory guidance for retail investors, including Investor, stresses documenting how performance is calculated, since past performance framed without that context routinely misleads readers about what to expect going forward.
Your trade log needs, at minimum:
- Entry and exit timestamps, not just dates.
- Position size, instrument, and setup tag.
- Fees, commissions, and estimated slippage per trade.
- Your stated rationale at entry, written before you know the outcome.
Pro Tip: Review your log on a fixed weekly cadence, not whenever you feel like it. Metrics calculated on fewer than 30 trades are statistically unreliable, so resist the urge to judge a strategy after a hot streak of five or six trades.
Why Does Looking at One Metric Always Lead You Astray?
A high win rate paired with a poor profit factor is the classic trap. So is a strong Sharpe ratio sitting on top of a strategy with a brutal, months-long drawdown that Sharpe’s variance-based math simply doesn’t capture. LuxAlgo’s breakdown of core trading metrics makes the point directly: profit factor, maximum drawdown, Sharpe ratio, win rate, and expectancy each answer a different diagnostic question, and reading only one invites a distorted conclusion.
Bootstrap resampling or a simple Monte Carlo shuffle of your trade sequence helps you see whether your results depend on the exact order trades happened to occur. If reshuffling the same 50 trades into random sequences produces wildly different drawdown outcomes, your strategy is more fragile than the single historical equity curve suggests.
- Cross-check every strong metric against at least one metric that measures a different dimension (return, risk, cost, or consistency).
- Run a Monte Carlo shuffle on your trade sequence before trusting a smooth-looking equity curve.
- Rank fixes using expected-dollar leak multiplied by feasibility, not by which mistake annoys you most.
Pro Tip: A mistake costing you $50 a trade across 200 trades a year is a $10,000 leak. Fix that before you touch a habit that costs $5 a trade twenty times a year.
What Concrete Actions Improve Measurable Trading Performance?
Metrics are diagnostic. Actions are the treatment. Once you know where the dollars are leaking, the fixes need to be specific and testable, not vague resolutions to “trade better.”
- Cap position size so your historical worst-case drawdown, replayed at that size, stays inside what you can tolerate without abandoning the strategy.
- Reduce turnover on setups where realized slippage eats more than 15% of average trade profit.
- A/B test one rule change at a time, holding everything else constant, and measure the effect on expectancy and net P&L over a minimum 30-trade sample.
- Build a ranked kill list of recurring errors, each with a quantified dollar cost, and eliminate the highest-impact one first.
Thinking in R-multiples, expressing every trade as a multiple of your initial risk, makes this prioritization sharper because it strips position-size noise out of your win/loss comparisons; the R-multiple discipline guide walks through why raw P&L numbers alone can mislead you about which trades actually worked.
How Does Forensic Trade Analysis Turn Metrics Into Fixes?
Calculating the right numbers is only half the job. Turning them into a ranked action list is where most traders stall out. A forensic workflow reconstructs every trade into a structured dataset, computes the full metric set, audits for recurring behavioral and execution errors, then ranks the fixes by dollar impact rather than by gut feeling.
The Final Tape runs this process using an AI Council of seven specialist analysts and a Chief Coaching Officer, each examining trades from a different angle, entries, exits, sizing, psychology, before debating their findings into a single prioritized report.
- Trades are reconstructed into structured datasets rather than left as raw broker exports.
- The analysis flags emotional errors and capital-preservation issues specifically, not just aggregate P&L swings.
- Fixes come ranked by quantified financial impact, so the highest-leak mistake gets addressed first.
How Do Psychological Biases Distort the Metrics You Trust?
Numbers don’t lie, but the trader reading them often does, mostly to themselves. Loss aversion pushes traders to hold losing positions longer than the plan calls for, hoping to avoid realizing the loss. That single habit inflates average loss size and quietly wrecks profit factor and expectancy, even when the entry logic was sound.
Recency bias does damage from the other direction. A trader who just had three winning trades starts sizing up, assuming the hot streak reflects skill rather than a normal run of variance within an expected distribution. When the streak ends, the drawdown hits harder because position size grew right before the reversal.
Confirmation bias shows up in how traders read their own metrics. It’s tempting to highlight the segment of trades that looks good, say, morning breakouts with a strong profit factor, while ignoring the afternoon reversals dragging the aggregate expectancy down. A trade log with honest setup tagging is the best defense here, because it forces every segment into the light whether it flatters you or not.
Overconfidence after a strong Sharpe ratio is another common trap. A strategy running hot over a short sample can produce an eye-catching risk-adjusted number that has more to do with a lucky sequence than durable skill. Reviewing your metrics on a fixed schedule, rather than checking obsessively during winning streaks and avoiding the log during losing ones, keeps bias from quietly rewriting your own track record.

How Do You Benchmark Trading Performance Against the Market?
Raw returns mean little without context. A strategy that returned 12% last year sounds solid until you notice a relevant index returned 18% over the same stretch with less volatility. Benchmarking answers the question your account balance alone can’t: are you actually generating skill-based returns, or just riding a rising market?
Choose a benchmark that matches what you actually trade. A day trader running index futures should compare against the relevant index, not a random basket of growth stocks. A swing trader in small caps needs a small-cap benchmark, not the S&P 500. Mismatched benchmarks make the information ratio and tracking-error calculations meaningless.
Beyond indices, peer comparison matters if you have access to it, particularly for traders on a funded or prop desk where anonymized cohort data sometimes exists. Comparing your Sharpe ratio or expectancy against peers trading the same instrument and timeframe tells you whether your edge is genuinely above average or just average performance dressed up by a favorable market.
The honest benchmark question isn’t “did I make money.” It’s “did I make more, risk-adjusted, than I would have by doing nothing more sophisticated than holding the index.” If the answer is no across a full market cycle, the strategy needs a rebuild, not a tweak.
Why Traders Fool Themselves With Their Own Numbers
Vanity metrics are seductive because they’re easy to calculate and flattering to look at. Win rate is the worst offender. Chasing a high win rate often means cutting winners early and letting losers run, the exact opposite of sound trade management, and it can coexist with a negative expectancy the whole time.
Real improvement comes from scheduled, unglamorous review. A quantified kill list, reviewed on a fixed calendar rather than after a bad week, holds you accountable to fixing the highest-dollar leak instead of whatever mistake is freshest in memory. Discipline beats intuition here almost every time.
— DigitalPunk
Turn Your Trade Log Into a Prioritized Action Plan
Most traders sit on months of trade history that never gets forensically analyzed. Thefinaltape is the alternative to guessing which mistake to fix next: instead of manually reconciling spreadsheets, its AI Council reconstructs your trades into structured datasets and ranks your recurring errors by dollar impact, so you know exactly which fix pays off first.
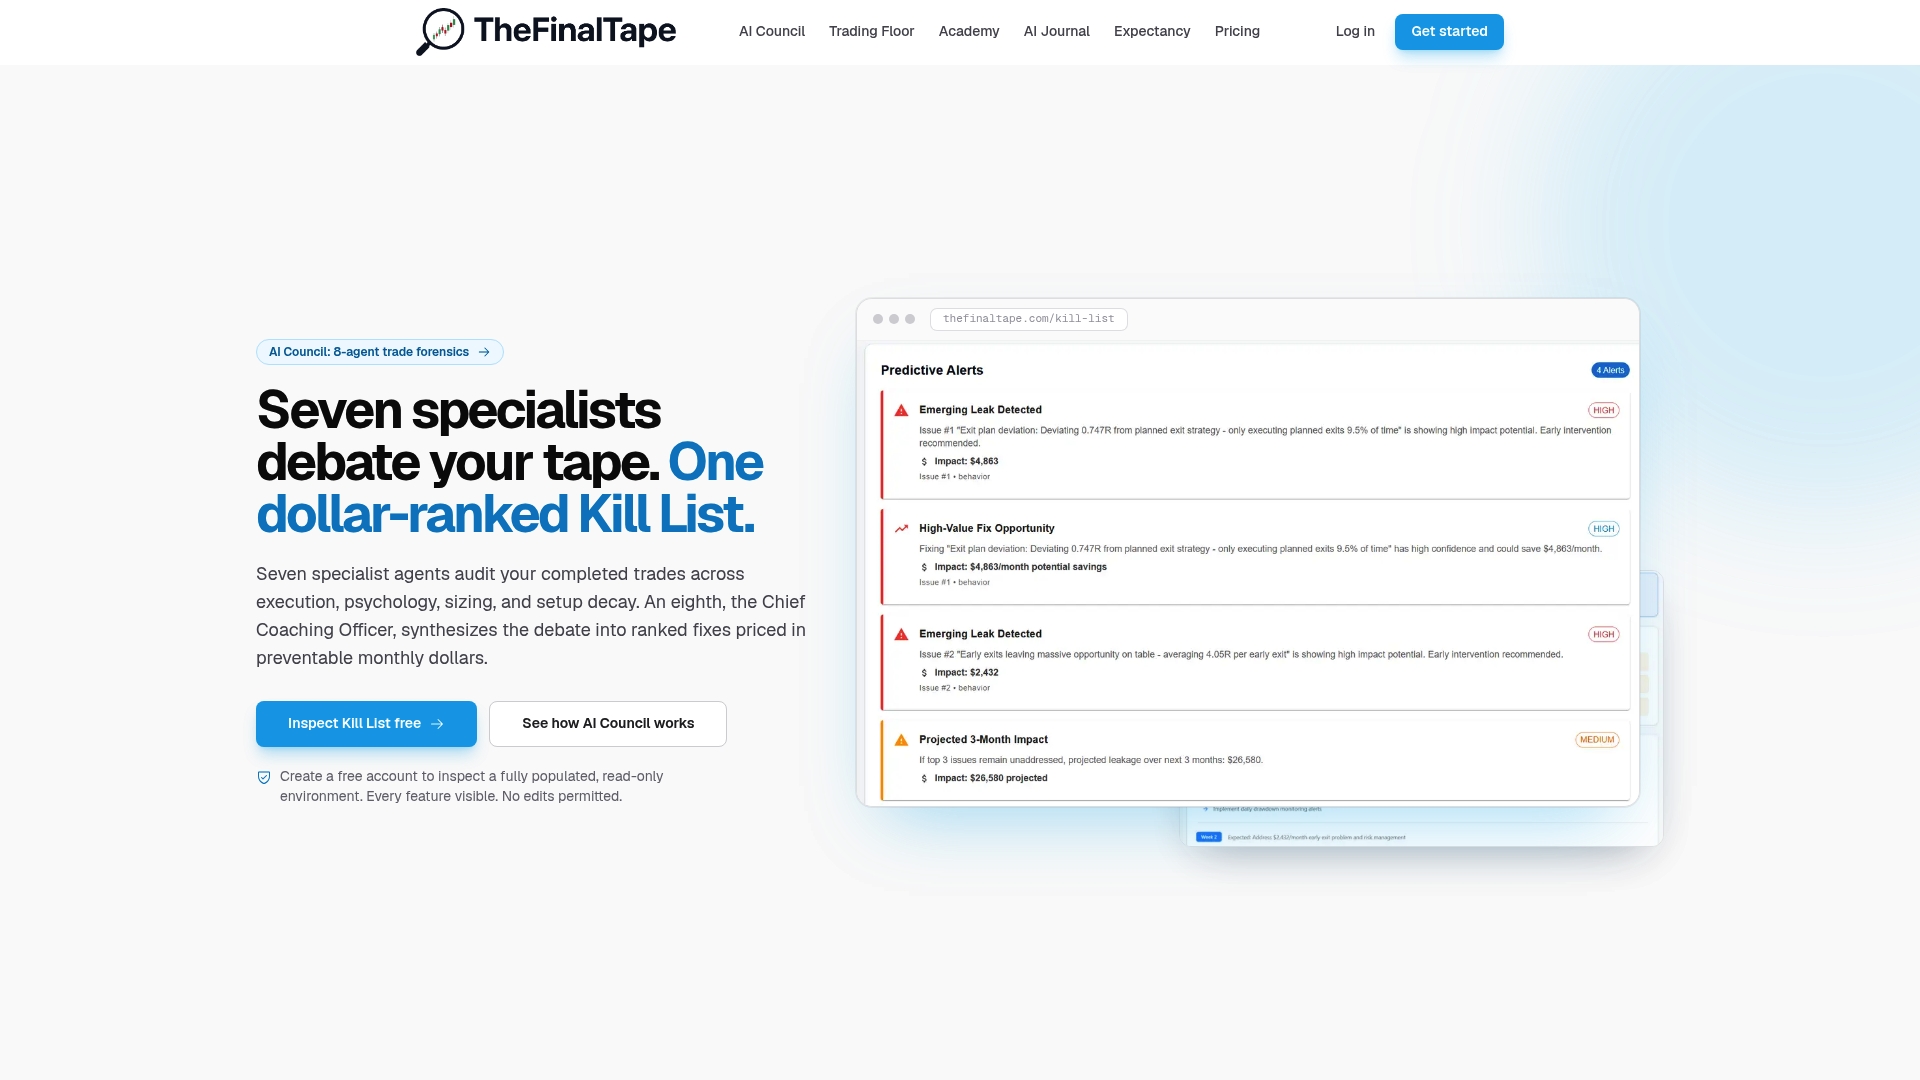
The Pro plan runs $12.50 per month or $150 per year and unlocks trade uploads, personalized AI analysis, and the full analytics suite, including the team trading workspace for desks that need shared visibility across traders. If you want to see the platform before committing, the Read-Only Inspection tier lets you explore the environment first. Either way, the trade review software turns the metrics covered in this article, expectancy, drawdown, and cost-adjusted P&L into a ranked kill list you can act on this week. Head to the pricing page to pick the plan that matches how deep you want the audit to go.
Where to Verify These Formulas and Standards
For readers who want the underlying math and regulatory context straight from the source, a few references stand out. CFA Institute publishes detailed technical papers on the Sortino ratio and Sharpe and information ratio mechanics. Stanford’s William Sharpe archive hosts the original ratio methodology. SEC fund disclosure filings show real turnover and cost disclosures worth studying if you want to see how professional managers report these numbers to regulators.
Sources
FAQ
How Do You Evaluate Trading Performance?
Evaluate trading performance by calculating expectancy, profit factor, and maximum drawdown net of all trading costs, over a sample of at least 30 to 50 trades. Reading these together, rather than any single metric alone, avoids the common trap of single-metric deception that misleads so many traders.
What Is the 90% Rule in Trading?
There’s no single authoritative source that confirms this exact figure, so treat it as a cautionary generalization rather than a verified statistic, and focus instead on your own measured expectancy and drawdown numbers.
How Do You Track Trading Performance Over Time?
Track trading performance with a structured log that records entry and exit timestamps, position size, fees, slippage, and a setup tag for every trade. Review the log on a fixed weekly or monthly cadence rather than only after wins or losses, and calculate time-weighted returns to separate strategy skill from the effect of cash deposits and withdrawals.
What Is the Difference Between Gross and Net P&L?
Gross P&L is your profit or loss before commissions, fees, and slippage. Net P&L subtracts those costs, and it’s the only version that reflects what you actually keep, since SEC disclosures confirm that turnover-driven costs can materially erode realized returns.
What Does Thefinaltape Cost?
Thefinaltape’s Pro plan costs $12.50 per month or $150 per year and includes trade uploads, AI-driven analysis, and full analytics access. The Read-Only Inspection tier has no published price and is available for platform exploration before subscribing.
Recommended
Stop reviewing from memory
Run compliance scoring, tag ranking, and Kill List rules on every trade — not once a month when the account feels off.