Audit Ready Trade Attribution: Dollar Ranked Kill List for Traders
Turn every trade into a dollar audit. Split P&L by execution, decision, and behavior, then get a ranked Kill List of verifiable fixes.

Audit Ready Trade Attribution: Dollar Ranked Kill List for Traders
Trading performance attribution breaks a trader’s profit and loss into three causes: execution, decision, and behavior, so you know exactly which one is costing you money. Done at the trade level, it produces a prioritized, dollar-ranked list of the errors doing the most damage, along with a plan to verify whether fixing them actually worked. The rest of this piece covers the data you need, the metrics that do the sorting, and the workflow that turns raw fills into a short list of fixes worth acting on.
TL;DR:
- Trade-level attribution can identify the specific causes of losses, such as execution errors, bad ideas, or behavioral biases, with significant dollar impacts.
- Behavioral biases like the disposition effect or excessive trading are often measurable and fixable, with studies showing they explain a substantial share of performance deviations.
- Accurate data including precise timestamps, fill details, and costs is essential; unreconciled or poor-quality data severely undermines the analysis.
- A typical audit requires analyzing at least 30 to 50 trades per error category and ranking errors by total dollars lost to prioritize fixes effectively.
- Implementing regular review cycles and assigning targeted corrective actions to specific errors helps turn performance attribution into ongoing accountability.
Table of Contents
- What trade-level attribution actually measures
- Why the dollar impact matters more than the average trader thinks
- The metrics that split P&L by cause
- Data inputs and cleaning steps that make the audit trustworthy
- The audit workflow that produces a ranked fix list
- Reading the results without fooling yourself
- Checklist and KPIs for after the audit
- Turning an audit into an accountability habit
- Where a dedicated audit tool fits into this process
- Sources
- FAQ
What trade-level attribution actually measures
Trade-level performance attribution reconstructs each trade from order to fill to exit, then asks a simple question for every dollar of profit or loss: was that dollar earned or lost through execution (how the order was worked), decision (whether the idea itself had edge), or behavior (whether you deviated from your plan)? That’s a distinct discipline from portfolio-level attribution, which explains a fund’s return relative to a benchmark using sector weights, factor exposures, and allocation effects. Portfolio attribution answers “why did the fund beat or trail its index.” Trade-level attribution answers “why did this specific trade lose $340, and would it have lost less with a different stop, a different entry timing, or a calmer head.”
The beneficiaries are individual traders, prop desks, and trading coaches who need forensics, not summaries. A monthly P&L statement tells you that you lost money.
Why the dollar impact matters more than the average trader thinks
The financial stakes behind attribution are larger than most traders assume. A widely cited study on individual investor trading found that individual investors underperform by roughly 3.8 percentage points a year because of their trading decisions, while institutions in the same dataset gained about 1.5 percentage points annually from theirs. That gap is not random noise. It is the accumulated effect of specific, repeatable errors: chasing entries, cutting winners early, holding losers too long, and sizing positions on conviction rather than on a tested edge.
A 2025 study on retail portfolios found a Model Explainability Ratio (MER) between 43.44% and 63.54% for behavioral biases against realized returns, meaning behavioral patterns explain a substantial and measurable share of performance, not just noise you can shrug off. That is the practical value of running this kind of audit: once a bias is measurable, it is fixable, and the dollars behind it are recoverable rather than theoretical.
The metrics that split P&L by cause
Attribution relies on three families of metrics, each targeting a different failure point.

Execution metrics isolate how well an order was worked. Implementation shortfall measures the gap between the price you intended and the price you got. Effective spread and fill rate flag slippage and missed liquidity. Mark-out analysis, tracking price movement in the minutes or hours after your fill, tells you whether the market moved against you because of timing or because the trade idea itself was wrong.
Decision metrics grade the idea, separate from how it was executed. Idea-level win rate and R-multiple distributions show whether your setups have edge before commissions and slippage touch them. Comparing expected edge (from backtested or planned R) against realized edge exposes whether losses stem from bad ideas or bad execution of good ones.
Behavioral metrics catch the gap between your plan and your actual conduct: holding-time ratios for winners versus losers, disposition-effect measures, and the MER concept above. Converting any of these into dollars is arithmetic once you have per-trade fills: multiply the shares or contracts by the price difference between actual exit and the plan’s intended exit, then sum by error category.
Data inputs and cleaning steps that make the audit trustworthy
Attribution is only as good as the trade data behind it. Garbage timestamps produce garbage mark-outs, and unreconciled fills produce a Kill List built on guesses.
- Trade and order identifiers, including parent and child order tags, so partial fills link back to the original decision.
- Precise timestamps for order placement, each fill, and exit, ideally to the second, to support mark-out and latency analysis.
- Fill details: price, size, venue, order type (market, limit, stop), and account ID for desks running multiple books.
- Fees and costs, normalized across venues so commission structure does not distort the execution numbers.
- Corporate action adjustments and a reconciliation step comparing your ledger against exchange or broker fill reports.
Without a reliable mapping between blotter entries and actual fills, mark-out and latency analysis produce numbers that look precise but mean nothing. The SEC’s proposed discussion of best execution underscores this: order-level review and cross-venue comparison require exactly this kind of clean, timestamped data before execution quality can be assessed with any confidence.
The audit workflow that produces a ranked fix list
Running the audit end to end follows a fixed sequence, and skipping steps is the most common reason attribution projects stall out.
- Reconstruct every trade from order to fill to exit using the cleaned dataset.
- Split each trade’s P&L into execution and decision components using implementation shortfall and mark-out windows.
- Classify the remaining variance into behavioral error types: early exits, oversized entries, revenge trades, plan deviations.
- Quantify the dollar impact of each error type by summing the P&L difference between actual and planned execution.
- Assemble the Kill List, ranking error types by total dollars lost, and assign an owner and a verification metric to each.
Mark-out windows of five, thirty, and sixty minutes after execution cover most short-term strategies; longer-horizon traders should extend windows to match their typical holding period. Aim for at least 30 to 50 trades per error category before trusting the dollar figure, since smaller samples swing wildly on a single outlier trade.
Pro Tip: Calculate projected recovery per fix by applying the historical average dollar cost of that error type to your typical monthly trade count, then treat that number as a hypothesis to test, not a guarantee.

Reading the results without fooling yourself
A dollar-ranked list is only useful if the causes behind it are diagnosed correctly, and a few traps catch even experienced analysts.
The disposition effect (cutting winners early, holding losers long) looks like a clear behavioral error, but experimental evidence from professional traders shows it can be a rational response in mean-reverting markets. Tag it as an error only after checking whether the asset class trends or reverts.
Excessive trading is often blamed on commissions and spreads, but research merging survey and transaction data found that perceived information advantage and gambling preference are frequently the larger drivers behind churn. If your Kill List blames costs alone, dig for the behavioral signal underneath.
Execution metrics can also be biased by factors outside your control: latency, broker order routing, and venue-specific dynamics such as those documented in research on dark pool latency arbitrage. Before acting on any fix, set a conservative confidence threshold, generally a large enough sample and a consistent pattern across market conditions, so you are not chasing noise.
Checklist and KPIs for after the audit
Once the Kill List exists, the follow-through is what separates an audit from a report nobody acts on.
- Confirm data integrity across timestamps, fills, and fees before trusting any dollar figure.
- Pull the top five dollar-loss trades and identify the single dominant error in each.
- Pick three immediate fixes, no more, and assign an owner and a deadline to each.
- Review execution quality with your broker or venue if slippage or fill rate stands out.
- Set position-sizing guardrails so no single behavioral error can repeat at full size.
- Define a verification window, typically 30 to 60 trades, before judging whether a fix worked.
| KPI | What it verifies |
|---|---|
| Dollar impact recovered | Whether the top Kill List items actually stopped bleeding money |
| Implementation shortfall (bps) | Whether execution quality improved after routing or timing changes |
| Fill rate | Whether order types or venue choices are capturing intended liquidity |
| Median R-multiple | Whether decision quality on new setups is holding up |
| MER change | Whether behavioral bias still explains a shrinking share of returns |
Turning an audit into an accountability habit
A coach reading a Kill List does not stop at the numbers. Pick the two or three worst-dollar trades, assign a specific corrective drill to each (a sizing rule, a hard exit trigger), and set a KPI with a fixed verification sample before declaring the fix done. That loop repeats weekly, not once a quarter, because behavioral drift creeps back fast without a check-in. Multi-agent audit processes, where several specialist reviewers debate a trade before a recommendation is finalized, tend to catch more of these patterns than a single pass ever does.
— DigitalPunk
Where a dedicated audit tool fits into this process
Running this workflow by hand across hundreds of trades is possible but slow, which is the exact gap The Final Tape is built to close. Its AI Council, seven specialist analysts plus a Chief Coaching Officer, reconstructs trades into structured datasets and debates the findings before producing a dollar-ranked Kill List with owners and a verification plan attached.
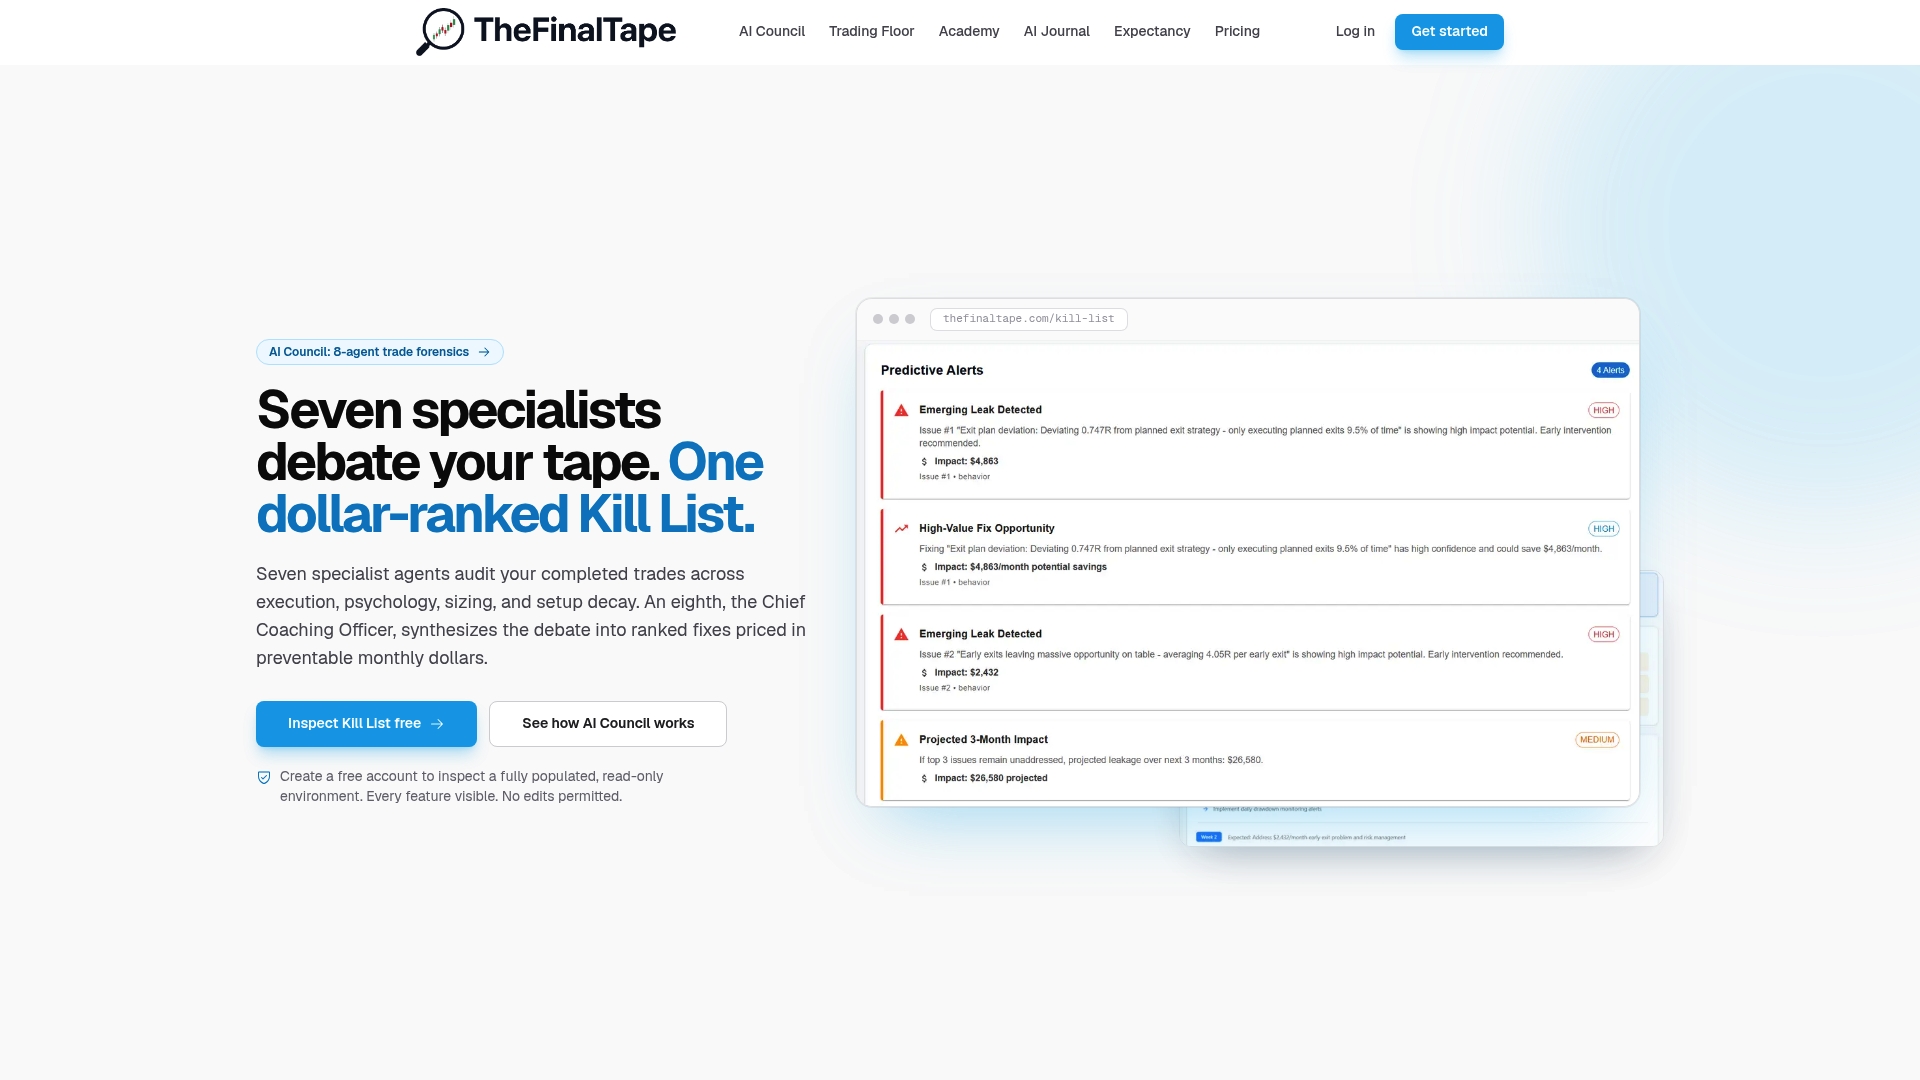
For readers who want to see the mechanics before uploading anything, the trade review software page walks through the forensic modules, and Lesson 31 on reading performance ratios covers how to interpret the outputs.
- Pro unlocks trade uploads, full AI analysis, and the team workspace, with current pricing details available on the pricing page.
- A Read-Only Inspection tier lets you explore the platform before committing to a paid plan.
- The AI trading journal ranks forensic findings automatically, described on the ranked trade forensics page.
Start with the Read-Only Inspection if you want to see how the audit works before your own data goes in.
Sources
- Just How Much Do Individual Investors Lose By Trading
- SEC proposed Regulation Best Execution (discussion of execution quality and disclosures)
FAQ
What is trading performance attribution?
It is a trade-level forensic process that splits each trade’s profit or loss into execution, decision, and behavioral causes, so you can see exactly which factor drove the outcome. The goal is a dollar-ranked list of fixable errors rather than a general performance summary.
How is trade-level attribution different from portfolio attribution?
Trade-level attribution examines individual trades to find execution, decision, and behavioral causes of P&L, while portfolio attribution explains a fund’s return against a benchmark using sector and factor exposures. They answer different questions for different audiences: traders and desks use the former, asset managers and analysts use the latter.
What data do I need to run a trade-level audit?
You need timestamped order and fill data, fees, venue and order-type details, and account identifiers, reconciled against your broker or exchange records. Missing or misaligned timestamps undermine mark-out and execution analysis before you even start classifying errors.
How long does a performance attribution review take?
The timeline depends on trade volume and data cleanliness, but a reasonable sample for reliable error categories is around 30 to 50 trades per category. Desks with clean, well-tagged data can often complete an initial audit and Kill List within a few days; messier datasets take longer to reconcile.
Can The Final Tape run this kind of audit for me?
Yes. The Final Tape’s AI Council reconstructs trades into structured datasets and produces a dollar-ranked Kill List with assigned verification steps, available through its Pro plan starting at $12.50 per month.
Recommended
Stop reviewing from memory
Run compliance scoring, tag ranking, and Kill List rules on every trade — not once a month when the account feels off.