Get a Dollar Ranked Kill List With Trade Reconstruction for Traders
Turn trade history into an AI-powered behavioral forensics workflow that produces a dollar-ranked Kill List, enforceable rules, and measurable results.

Get a Dollar Ranked Kill List With Trade Reconstruction for Traders
Trade reconstruction rebuilds your executed trades and surrounding context into structured, timestamped datasets that reveal exactly which behaviors are costing you money. The payoff is concrete: a prioritized, dollar-attributed list of errors, ranked by financial damage, that tells you what to fix first. Instead of guessing why your equity curve stalls, you get a forensic record of the decisions behind it.
TL;DR:
- Trade reconstruction requires at least 200 to 500 trades over 90 days for reliable behavioral analysis.
- It depends on detailed data including timestamps, prices, fees, and trade notes for accurate identification of costly mistakes.
- Rebuilding and normalizing data is crucial, especially reconciling partial fills and ensuring consistency before analysis.
- Behavioral flags and error ranking focus on dollar impact, guiding prioritized rule implementation and verifying improvements over one to three months.
- The process is available through Thefinaltape’s platform, which offers automated analysis, a detailed JSON export, and coaching support.
Table of Contents
- What Trade Reconstruction Means for Traders (And When to Use It)
- What Data You Need Before You Start
- How the Reconstruction Pipeline Actually Works
- What You Get Out of a Reconstruction
- Turning Findings Into Rules That Stick
- Inside a Trade Reconstruction Audit at this platform
- Where Reconstruction Breaks Down (and What to Expect)
- Run Your Own Reconstruction Without Building the Pipeline Yourself
- Sources
- FAQ
What Trade Reconstruction Means for Traders (And When to Use It)
In this context, trade reconstruction has nothing to do with regulatory audits or reassembling order books for a compliance officer. It’s a behavioral forensics process: pulling your executed trades, timestamps, and notes into a structured dataset, then analyzing that dataset for repeated mistakes and their cost.
The boundary matters. This method focuses on execution quality, decision patterns, and coaching outcomes, not surveillance or legal defensibility. You use it when you need answers a P&L statement can’t give you.
Common triggers for running one:
- A strategy backtests well but bleeds money live, and you can’t isolate why.
- A desk wants to validate whether a new rule (like a daily loss cap) actually changed behavior.
- A trader keeps giving back gains late in the session and needs a “morning after” review of what happened, trade by trade.
- Leadership wants an objective comparison across a team instead of relying on gut feel about who’s disciplined.
If you’re building a compliance record instead, this framework isn’t the right tool. Behavioral trade reconstruction is about performance, not audit trails.
What Data You Need Before You Start
Bad inputs produce false conclusions, and in behavioral forensics a false conclusion means coaching the wrong habit. Before any reconstruction, confirm your export includes the essentials.
Required fields for a valid reconstruction:
- Symbol, side, and quantity for every fill.
- Entry and exit timestamps, ideally to the second, not just the date.
- Entry and exit prices, plus any partial-fill detail.
- Fees and realized P&L per trade, not just aggregated totals.
- Trade notes or tags, even informal ones, since these anchor behavioral labeling later.
Order IDs, execution venue, and route data aren’t mandatory but sharpen the analysis considerably, especially when comparing execution quality across brokers.
Quality control matters as much as field completeness. Consistent trader identifiers across accounts, normalized timezones, aligned entry and exit timestamps, and standardized fee formatting all need to be in place before a model can trust the dataset. Strong AI or machine-learning based forensics depend on this kind of data governance: consistent identifiers, aligned timestamps, and reference data that doesn’t drift week to week.
Sample size sets the floor for reliability. A reconstruction run on 20 trades will surface noise, not patterns. Most practitioners target a minimum of 90 days or 200 to 500 trades before trusting behavioral flags, since smaller windows can’t distinguish a bad week from a bad habit.
Pro Tip: If your broker export splits partial fills across multiple rows, reconcile them into single trade records before uploading. Unmerged fills inflate trade counts and distort your win rate.
How the Reconstruction Pipeline Actually Works
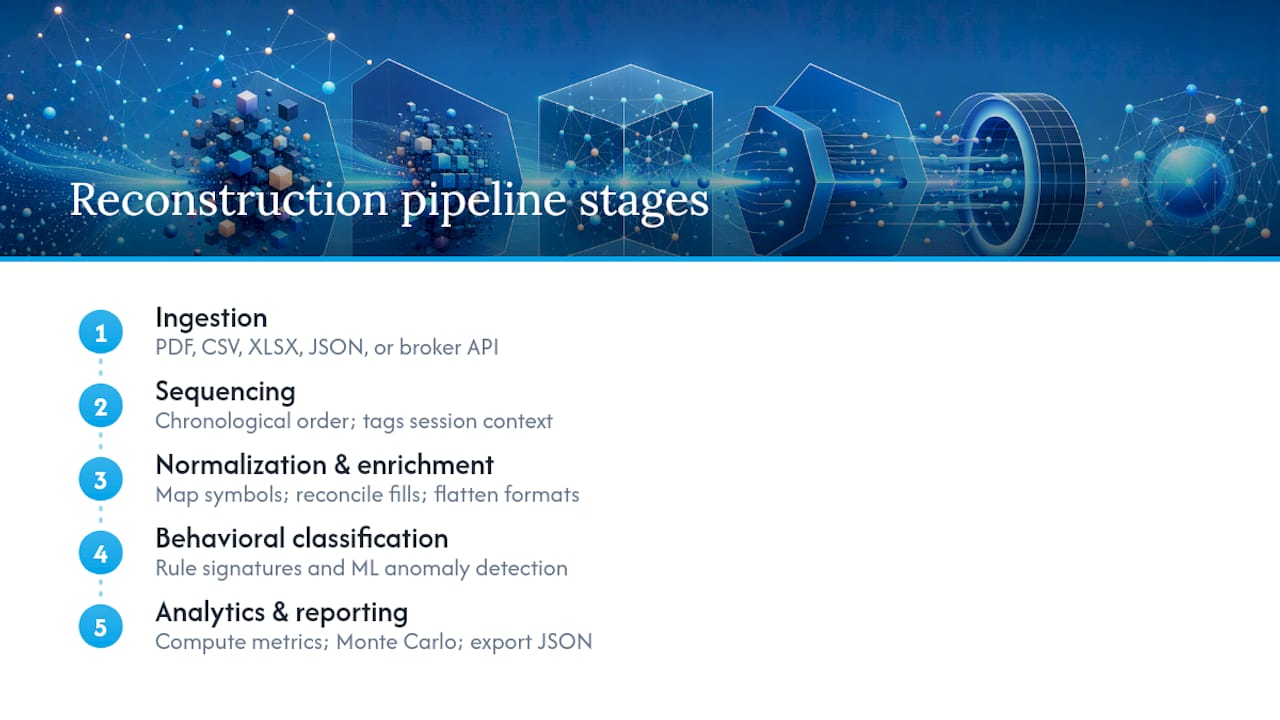
The process runs in five stages, whether you’re building it yourself or running it through a platform.
Ingestion. Broker exports arrive as PDF, CSV, XLSX, or JSON, or sync directly through a broker API. This stage just gets raw data into a workable format.
Sequencing. A trade sequencer orders everything chronologically, handles gaps in the data, and tags each trade with session context, such as pre-market, regular hours, or overnight.
Normalization and enrichment. Symbols get mapped to a consistent reference set, fills get reconciled against orders, and inconsistent formatting from different brokers gets flattened into one schema.
Behavioral classification. This is where the forensics happens. Rule-based signatures catch known patterns like oversized positions after a loss, while machine learning anomaly detection catches things nobody thought to write a rule for. Unsupervised approaches like Isolation Forest models are useful here precisely because labeled examples of bad behavior are always scarce compared to normal trades.
Analytics and reporting. The pipeline computes standard metrics, runs Monte Carlo simulations against your actual trade distribution, and exports results, often as structured JSON, for downstream use in dashboards or coaching tools.
Each stage depends on the one before it. Skip proper sequencing and your behavioral classifier will misread session context. Skip normalization and your metrics will be technically accurate but practically meaningless.
What You Get Out of a Reconstruction
The output splits into three layers, each answering a different question.
The executive dashboard answers “how did I actually do?” Net P&L, win rate, expectancy, Sharpe ratio, maximum drawdown, and the equity curve itself all live here. This layer alone won’t tell you why, but it’s the scoreboard everything else explains.
The behavioral layer answers “what did I do wrong, and how much did it cost?” This is where flagged trades get sorted into an error taxonomy. Systems built for this kind of analysis typically flag categories like revenge trading, overleverage, and FOMO entries, assign a severity score to each, and attribute an estimated dollar cost per error type. The output is a “Kill List,” the handful of behaviors responsible for most of your losses, ranked by financial impact rather than frequency.

Advanced analytics round it out: Monte Carlo projections stress-test your strategy against thousands of simulated sequences, Kelly sizing suggests position limits based on your actual edge, and hourly P&L heatmaps show exactly when in the trading day you tend to lose discipline.
Statistic Callout: Reconstruction tools built around this framework can export datasets with more than 70 distinct fields, covering everything from executive summary metrics to Monte Carlo output to behavioral forensics flags in a single structured file. That level of granularity is what makes automated coaching workflows and rule-tracking possible instead of manual spreadsheet review.
Turning Findings Into Rules That Stick
A reconstruction is only useful if it changes behavior. That means converting flagged errors into concrete, enforceable rules, not vague resolutions to “trade better.”
- Rank by dollar impact, not frequency. A behavior that happens twice a month but costs $3,000 each time outranks one that happens daily for $50. Fix the expensive habit first.
- Write the rule as a hard mechanism. Examples: a mandatory cooldown after two consecutive losses, a hard position-size cap after a losing week, or a full exclusion from trading during the first fifteen minutes of the session if that window shows up as a loss cluster.
- Assign ownership and a verification date. Someone, whether that’s you or a coach, needs to check in 30 days later and confirm the rule is actually being followed.
- Re-run the reconstruction after the change. Compare net P&L and behavioral scores before and after. If the numbers don’t move, the rule wasn’t specific enough, or wasn’t followed.
Pro Tip: Don’t try to fix five behaviors at once. Pick the top one or two items on your Kill List, implement the rule, and measure for a full cycle before adding more constraints. Stacking too many rules at once makes it impossible to know which one actually worked.
Inside a Trade Reconstruction Audit at this platform
The platform runs reconstruction through an AI Council: multiple specialist analysts plus a Chief Coaching Officer who debate findings before delivery. This structure aims to catch single-point biases that occur when one model or analyst reviews trades alone.
A typical engagement includes:
- A Post-Trade Review Template you can reuse on your own after the initial audit.
- A quantified Kill List ranking your top behavioral errors by dollar impact, not gut feel.
- A full JSON export covering the underlying metrics for anyone who wants to build custom dashboards or feed results into a team’s own systems.
- Linked coaching lessons, including modules on performance breakdown and trade management, tied directly to whatever your audit flags.
The process runs upload, dashboard, prioritized recommendations, then coaching and verification, with accessible reporting formats.
Where Reconstruction Breaks Down (and What to Expect)
Reconstruction fails quietly when the data is bad. Missing timestamps, inconsistent trader IDs across accounts, or fee fields that don’t reconcile will produce confident-looking output that’s simply wrong. No model catches every false positive either. A cluster of trades might look like revenge trading when it was actually a legitimate scalping strategy, and a human still needs to adjudicate the edge cases.
The other trap is overfitting rules to a small sample. A pattern that shows up in 15 trades isn’t a habit yet. Give any new rule a full measurement cycle, typically one to three months, before deciding whether it actually moved your numbers.
— DigitalPunk
Run Your Own Reconstruction Without Building the Pipeline Yourself
Thefinaltape is the alternative to building this pipeline in-house or hiring an outside auditor: you get the multi-agent AI Council’s dollar-attributed Kill List and a full JSON export without writing a line of classification logic yourself.
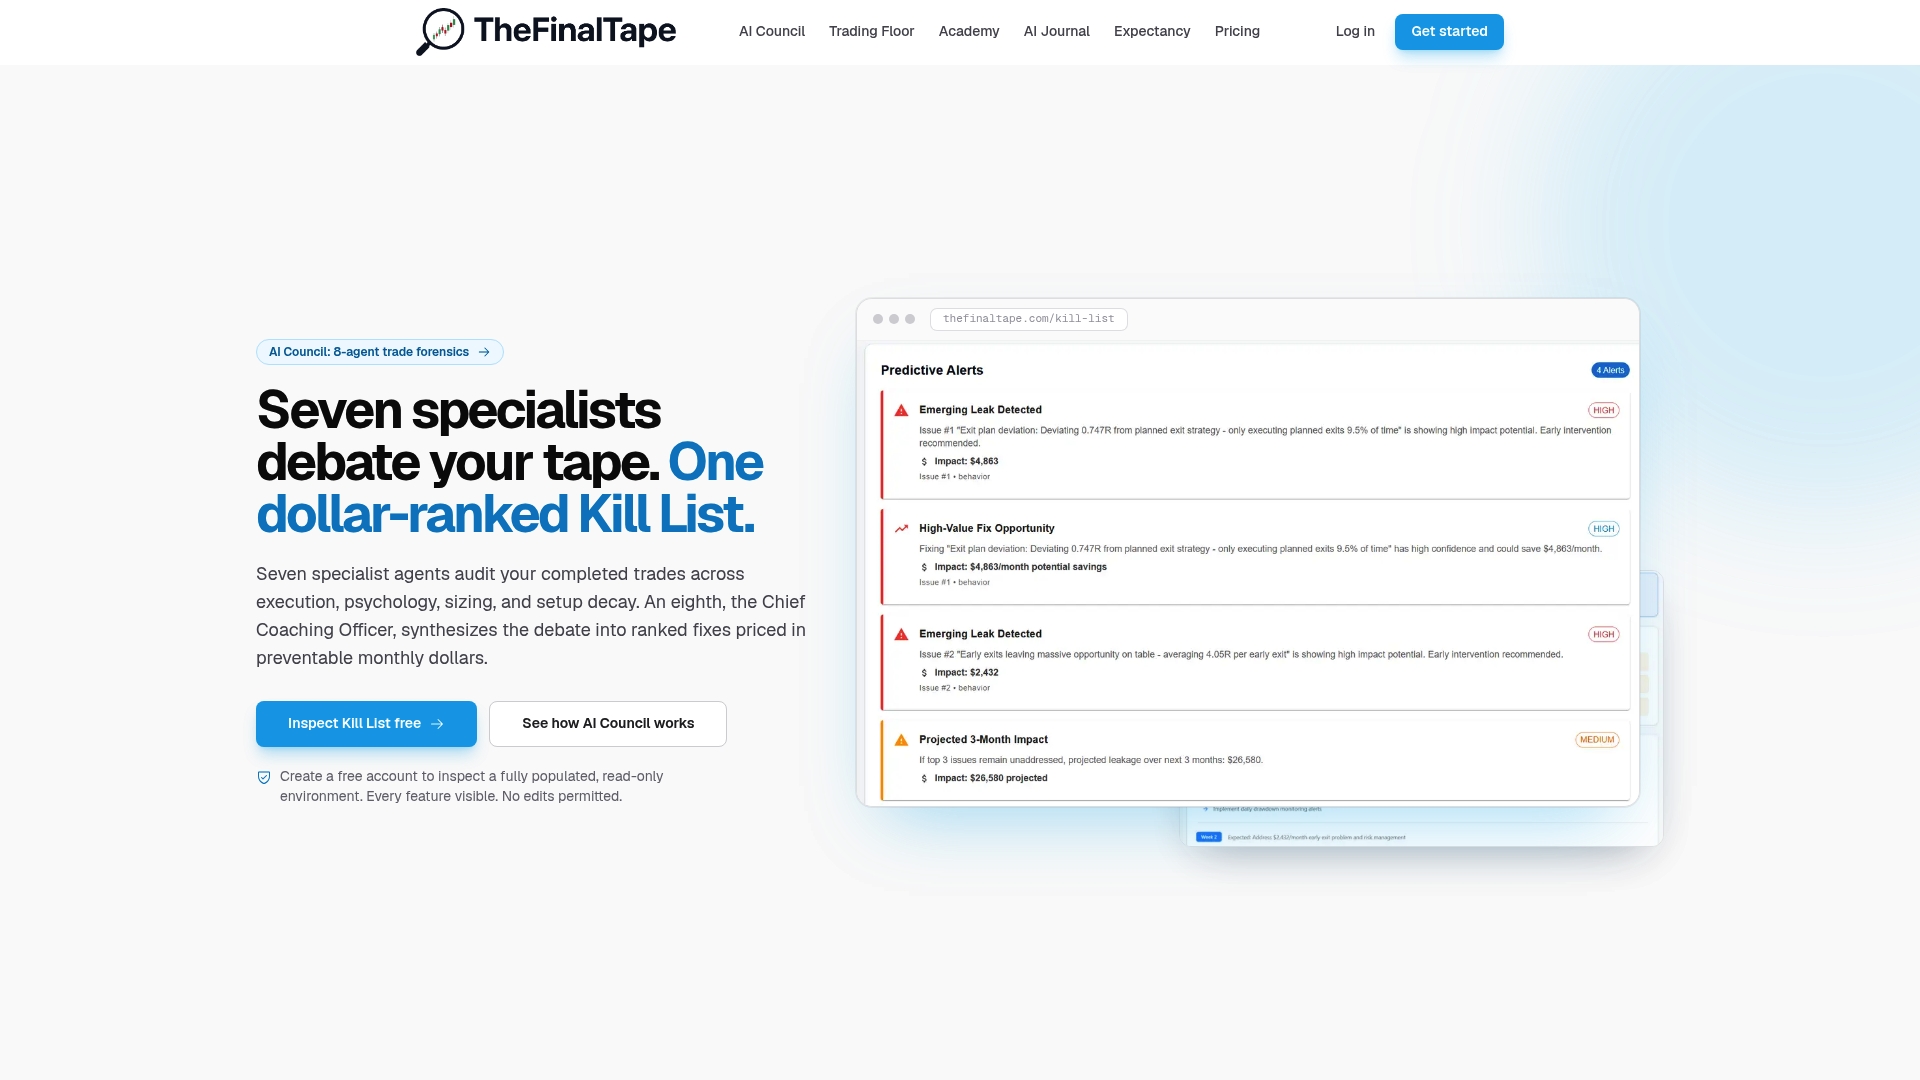
A pilot audit works like this: upload your broker export, the AI Council runs the full reconstruction pipeline against it, and you get back a dashboard with prioritized recommendations, not a raw data dump. The Trade Review Software platform handles the ingestion and behavioral classification automatically, and the AI Council overview walks through exactly how the seven analysts and Chief Coaching Officer reach their conclusions. The free tier lets you inspect the platform and sample outputs before uploading anything of your own. When you’re ready to see what your own trade history reveals, start with a sample audit and decide from there.
Sources
For readers who want to see the underlying architecture, the open-source trading audit dashboard shows real dashboard fields and JSON structure. The AI trading journal audit tool documents behavioral flagging logic in detail, and historical data replay explains how different data layers affect reconstruction depth.
- Technological transformation via AI & behavioural analytics in trade surveillance | First Derivative
FAQ
What Is Trade Reconstruction in Trading?
Trade reconstruction rebuilds your executed trades and their context into a structured dataset used for behavioral forensics, not regulatory compliance. It identifies recurring errors like overleverage or revenge trading and attributes a dollar cost to each so you know which habit to fix first.
How Many Trades Do I Need for a Reliable Reconstruction?
Most practitioners recommend at least 90 days or 200 to 500 trades before trusting behavioral flags. Smaller samples can’t reliably separate a bad week from an actual pattern.
What Data Do I Need to Run a Trade Reconstruction?
You need symbol, side, quantity, entry and exit timestamps, entry and exit prices, fees, and realized P&L for every trade at minimum. Order IDs, route, and execution venue aren’t required but improve the accuracy of the analysis considerably.
How Long Does It Take to See Results After Implementing a Rule?
Expect a measurable improvement window of one to three months after implementing a new rule, since you need a full cycle to distinguish a real fix from noise. Re-running the reconstruction afterward and comparing net P&L and behavioral scores is the only reliable way to confirm the rule worked.
Does Thefinaltape Only Work for Institutional Trading Desks?
No. Thefinaltape’s free tier lets any trader inspect the platform and sample outputs, while the Pro subscription unlocks trade uploads and personalized AI Council analysis for individual traders and teams alike.
Recommended
Stop reviewing from memory
Run compliance scoring, tag ranking, and Kill List rules on every trade — not once a month when the account feels off.