Traders, Cut Your Risk of Ruin Below 5% Using Your Trade Journal
Calculate your risk of ruin from real trades. Use exact inputs, run a journal based Monte Carlo, and adjust position sizing to aim under 5%.

Traders, Cut Your Risk of Ruin Below 5% Using Your Trade Journal
Risk of ruin is the probability that your trading bankroll drops below a survival threshold you can’t recover from, given your current win rate, payoff ratio, and risk per trade. Retail traders should target a number under 5%, and under 1% if you’re managing serious capital. The inputs you need to check your own number: starting bankroll, risk per trade, win rate, and reward-to-risk ratio.
TL;DR:
- Keeping risk of ruin below 5% for retail traders or 1% for large capital management requires precise input data, especially win rate, payoff ratio, and bankroll size.
- Small changes in inputs like win rate or bet size significantly impact ruin probabilities, so continuous recalculation with real trading data is essential.
- Using Monte Carlo simulations offers a more realistic risk assessment by modeling trade correlations and sequence risk beyond fixed formulas.
- Setting strict stop-loss rules, limiting risk per trade, and avoiding large position sizes are key practical steps to lower risk of ruin.
- Relying on a one-time risk of ruin calculation is risky, as market conditions and trader performance evolve, making ongoing monitoring critical.
Table of Contents
- What risk of ruin measures and how it differs from drawdown
- How to calculate risk of ruin
- What counts as an acceptable RoR number?
- Practical ways to reduce risk of ruin
- Monte Carlo simulation vs. calculator formulas: which should you use?
- Running a RoR check from your own journal data
- Quick checklist: check your RoR and act on it
- The part of risk of ruin nobody wants to hear
- Sources
What risk of ruin measures and how it differs from drawdown
Risk of ruin comes from a branch of probability called gambler’s ruin, which models what happens when someone with finite capital keeps betting against a fixed edge. The math shows that even a small negative edge, played out over enough bets, drives the bettor to zero eventually. Trading versions of the model swap “bets” for trade outcomes and calculate the odds of hitting a wipeout line before growing the account.
Drawdown is different. Drawdown is what already happened, an observed peak-to-trough decline you can measure in your equity curve after the fact. RoR is forward-looking: it’s a probability, not a record.
That distinction matters for how you use each number:
- Drawdown tells you how bad things got historically.
- RoR tells you how likely a similarly bad (or worse) stretch is to actually finish you off.
- “Ruin” doesn’t always mean zero. Many traders define it as losing a substantial portion of starting capital, the point at which recovery becomes mathematically brutal.
A 50% drawdown, for instance, requires a 100% gain just to get back to even. Many traders treat that level as functionally ruinous long before the account hits zero.
How to calculate risk of ruin
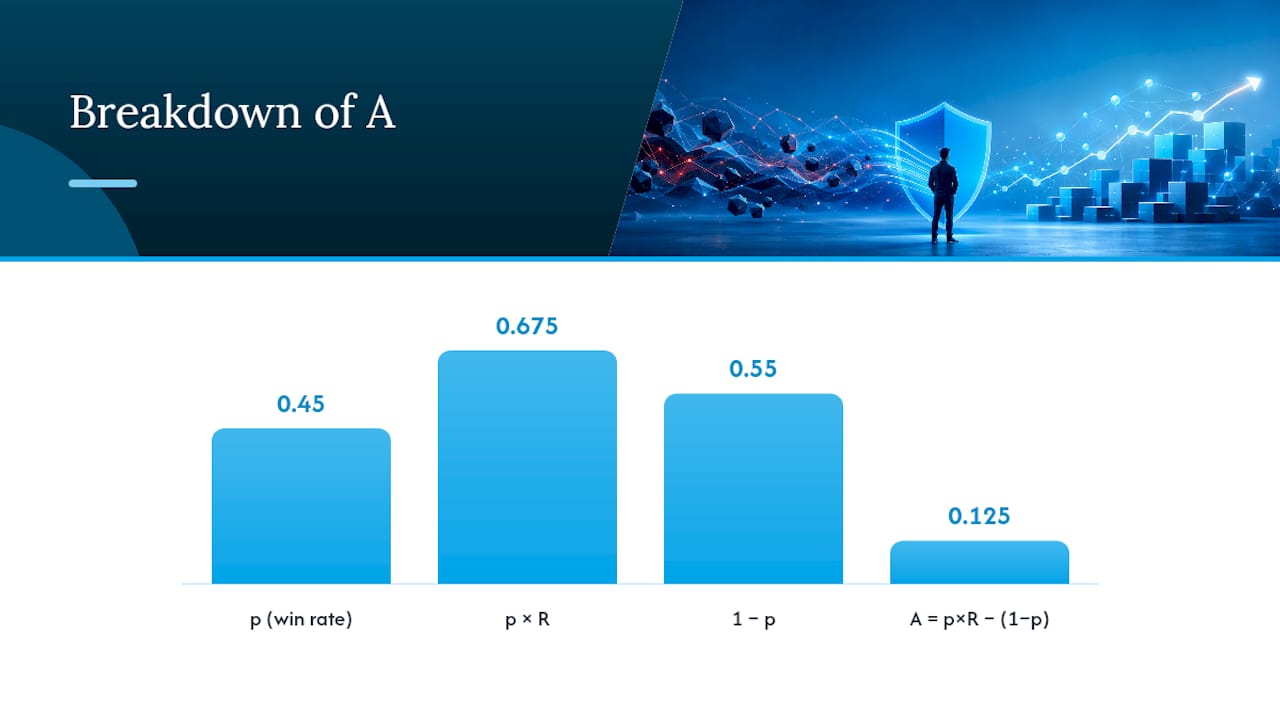
The classical closed-form approximation for risk of ruin, cited widely in position-sizing literature, looks like this:
RoR ≈ ((1 − A) / (1 + A)) ^ (capital units / risk units)
Where A = (p × R) − (1 − p)
Here’s what each variable means:
- p = your win rate, expressed as a decimal (a 45% win rate is 0.45)
- R = your payoff ratio, average win divided by average loss
- Capital units / risk units = your bankroll divided by your risk per trade, which tells you how many losing bets in a row it would take to hit ruin
Walk through a real example.
A = (0.45 × 1.5) − 0.55 = 0.675 − 0.55 = 0.125
Your capital units equal 1 / 0.02, or 50 risk units across your full bankroll.
Plugging that into the formula gives roughly:
What counts as an acceptable RoR number?
That’s not a forecast for next week. It’s a long-run probability baked into your current inputs.
Different corners of the trading world tolerate very different numbers:
- Institutional desks and prop firms typically want RoR under 1%, sometimes far lower, because they’re managing other people’s capital and regulatory scrutiny.
- Serious retail traders generally treat anything under 5% as workable.
- Anything above 10% is a warning sign. At that level, DayTradingToolkit’s beginner-focused breakdown of the math notes that even a genuinely profitable strategy can still carry meaningful ruin risk if per-trade sizing is too aggressive.
RoR is also brutally sensitive to small input changes. The formula doesn’t reward good intentions. It rewards precise inputs.
Practical ways to reduce risk of ruin
Lowering RoR doesn’t usually require a better strategy. It requires smaller, more disciplined bets on the strategy you already have.
- Cut risk per trade first. Beginners should stay in the 0.5% to 1% range per trade; even experienced traders with a proven edge rarely need to go past 2%.
- Use fractional Kelly, not full Kelly. The full Kelly Criterion formula maximizes long-run growth mathematically, but it assumes you know your true edge with certainty, which you never do. Most professional risk guidance settles on a quarter to half Kelly to absorb estimation error.
- Set hard daily and weekly loss limits. A limit that forces you to stop trading after a defined loss protects against the tail events that closed-form formulas tend to underweight.
- Watch correlation across open positions. Two trades each risking 1% can behave like one 2%+ risk during a correlated market shock, quietly inflating your real exposure.
- Keep stop-loss discipline non-negotiable. A formula-perfect risk percentage is worthless if you widen stops mid-trade.
Pro Tip: *The relationship between stake size and RoR isn’t linear. If you want the exact math behind why so many traders still overshoot on sizing, the 1% rule breakdown covers where that heuristic tends to get breached in practice.
Monte Carlo simulation vs. calculator formulas: which should you use?
Closed-form calculators are fast and transparent. Plug in your win rate, payoff ratio, and risk per trade, and you get a number in seconds. The catch: they assume independent trades and a fixed stake, which almost no real trader actually has.
Monte Carlo simulation solves that by running your stats through thousands of randomized trade sequences instead of one clean formula. It captures sequence risk, the fact that five losses in a row early in a strategy’s life hits differently than five losses spread across a year. It can also model variable position sizes and correlated trades, both of which closed-form math tends to underweight.
Statistic Callout: A Monte Carlo simulation approach generates a full distribution of possible account outcomes rather than a single ruin probability, letting you see, for example, that the same 6% RoR figure might hide a 15% chance of a 40%+ drawdown even in paths that technically “survive.”
When setting simulation inputs, build in some humility about your edge:
- Add an uncertainty band around your win rate rather than treating it as fixed.
- Vary bet size slightly to mirror real-world execution rather than assuming perfectly consistent sizing.
- Flag correlated positions explicitly, since correlation is often the hidden factor that makes real portfolios riskier than the formula suggests.
Running a RoR check from your own journal data
The most reliable RoR number comes from your actual trade history, not a hypothetical win rate you assume applies to you.
- Export your trade log and pull the real win rate, average win, average loss, and risk per trade actually used, not the plan you meant to follow.
- Run those numbers through a Monte Carlo simulation using conservative, slightly widened uncertainty bands rather than your best-case stats.
- Review the output for time-to-ruin distribution and worst-case drawdown paths, not just the headline RoR percentage.
- Adjust stake size based on what the percentile outcomes actually show, then rerun.
The Final Tape’s risk of ruin simulation tool builds this workflow directly from journal exports, and Lesson 48 in the academy walks through reading the resulting percentile bands without overreacting to a single bad-tail path.
Quick checklist: check your RoR and act on it
- Pull your last 50 to 100 trades and calculate win rate, average reward to risk, and typical risk per trade.
- Run the closed-form formula for a fast read, then confirm it with a simulation if your trade sizes or correlation vary.
- Compare your result against your target: under 5% for active retail trading, under 1% if you’re managing significant capital or other people’s money.
- If RoR comes in high, cut risk per trade before touching anything else, then tighten stops and rerun the numbers.
- If the number stays elevated after sizing changes, that usually points to a structural problem in the strategy itself, worth a full trade forensics review rather than another tweak.
The part of risk of ruin nobody wants to hear
Most traders treat risk of ruin as a math exercise they do once and forget. That’s backwards. Your win rate drifts, your average payoff ratio shifts with market conditions, and your actual risk per trade creeps upward the moment you’re on a winning streak. A RoR calculation from three months ago is describing a trader who doesn’t exist anymore.
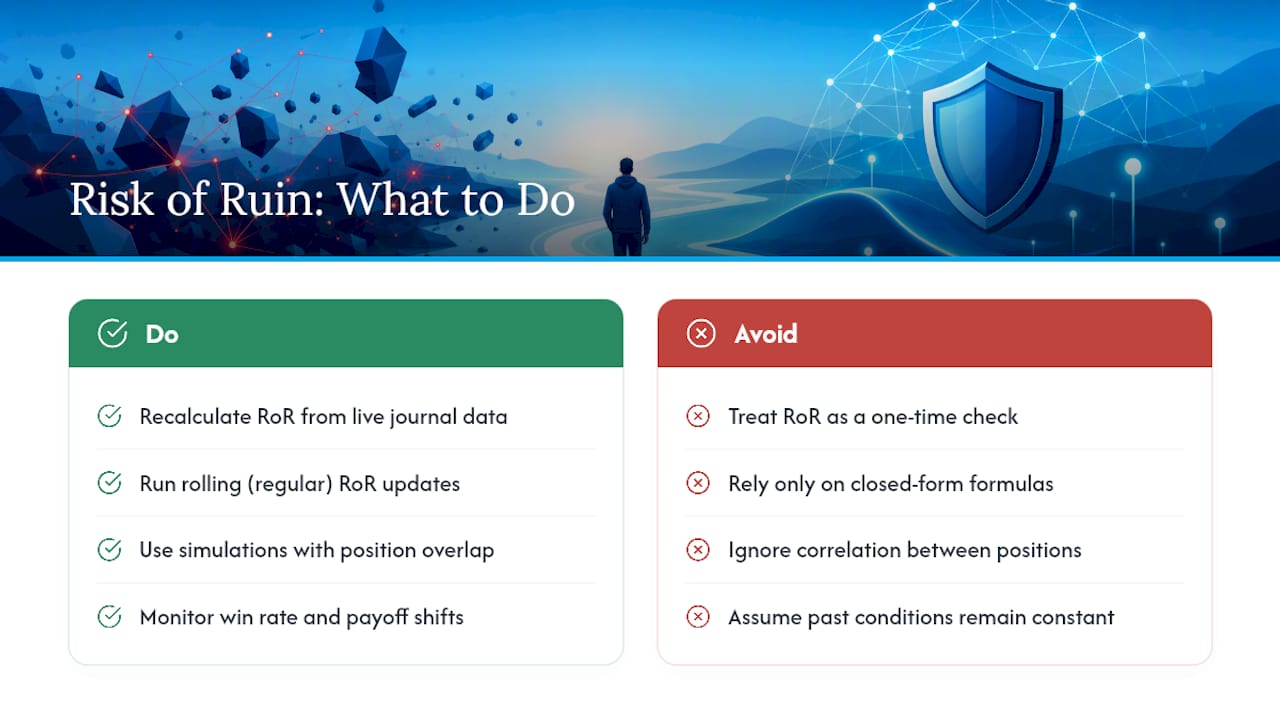
The bigger blind spot is correlation. Closed-form formulas can’t see that. Only a simulation built on your real position overlap can.
If there’s one thing worth prioritizing over everything else in this article, it’s recalculating RoR from live journal data on a rolling basis, not treating it as a one-time diagnostic. The traders who blow up rarely do so because they never calculated the number. They calculated it once, under kinder conditions, and never checked again.
— Docze
This article is general information, not a substitute for advice from a qualified financial advisor. Consult a qualified financial professional about your own circumstances before acting on anything here.
Sources
Recommended
Stop reviewing from memory
Run compliance scoring, tag ranking, and Kill List rules on every trade — not once a month when the account feels off.