Convert 20–30 Trades to R Multiples in 30 Days for Traders
Switch your journal from dollars to R multiples. Convert 20–30 trades step by step, calculate expectancy, and use a dollar ranked Kill List to prioritize...

Convert 20–30 Trades to R Multiples in 30 Days for Traders
R is the amount of money you risk on a trade, measured from your entry to your initial stop. An R-multiple is simply your realized profit or loss divided by that risk, so a trade that nets three times what you risked closes at +3R. Traders who track outcomes this way, instead of raw dollars, can compare setups fairly and calculate true expectancy. Once you have a few dozen trades logged in R, you can convert your entire journal and start reading your results like a professional desk does.
TL;DR:
- Traders should maintain accurate records of initial risk and outcome in R to better evaluate their trading systems’ real expectancy.
- A strategy with 3R average winners only requires a 25% win rate to break even, emphasizing the importance of letting winners run.
- Converting existing trade logs into R-multiples helps identify behavioral and process errors, such as moving stops or inconsistent risk tracking.
- Using R units for risk management rules, like daily loss limits or position sizing, offers more scalable and reliable control across account sizes.
- Analyzing R distribution patterns and advanced statistics can uncover hidden issues in strategy performance, such as skewness or high variability.
Table of Contents
- What Are R and R-Multiples, Exactly?
- How to Calculate R and R-Multiples Step by Step
- Expectancy, Breakeven Win Rate, and Reading Your R Distribution
- Converting Your Trading Journal to R-Multiples
- Common Mistakes That Wreck Your R Data
- How Structured Trade Audits Turn R Data Into Fixes
- Incorporating Risk Management Strategies With R-Multiples
- How R-Multiples Play Out Across Trading Styles and Assets
- Where R-Multiples Fall Short
- Advanced Statistical Analysis of R-Multiple Distributions
- What Switching to R-Only Journaling Actually Changes
- Turn Your R Data Into a Prioritized Action Plan
- Sources
- FAQ
What Are R and R-Multiples, Exactly?
R equals the dollar amount you put at risk between your entry price and your initial stop loss. If you buy a stock at $50 and place your stop at $48, and you’re holding 50 shares, your risk is $2 per share times 50 shares, or $100 total. That $100 is your 1R for this trade.
Everything that happens afterward gets measured against that number. Close the trade for a $300 profit and you’ve made +3R. Get stopped out at your initial stop and you’ve lost exactly −1R. Scale out half your position at a target and hold the rest, and you can log the exit as a fractional R, say +1.5R for the partial plus whatever the remainder closes at.
A few quick reference points:
- +3R means you made three times your initial risk.
- −1R is a full loss at your original stop, the worst case if you never move it.
- 0R applies when you’re stopped out at breakeven after trailing your stop.
- +0.5R is common on partial exits or trades you close early for a smaller gain.
The unit stays constant no matter what you’re trading or how much capital is behind the trade, which is the entire point.
How to Calculate R and R-Multiples Step by Step
The formula is short: R-multiple = (exit profit or loss in dollars) ÷ (initial risk in dollars). The work is in recording the inputs correctly, not the math itself.
Here’s the sequence every trade should follow:
- Log your entry price and your initial stop the moment you place the trade.
- Calculate position size, then multiply by the per-share or per-unit distance between entry and stop to get your dollar risk. That’s your 1R.
- Record your exit price and calculate the dollar profit or loss.
- Divide the outcome by the 1R figure from step 2. That’s your R-multiple.
- Keep the original 1R fixed for the life of the trade, even if you move your stop later.
A quick worked example: you buy 200 shares of a stock at $20 with a stop at $19.50. Your risk per share is $0.50, so your 1R is $100. You exit at $21.50 for a $1.50 per share gain, or $300 total. Divide $300 by $100 and you land at +3R.
Forex works identically once you convert pips to dollars. Risking 50 pips at $1 per pip is a $50 risk, and a 100 pip winner is +2R, regardless of the currency pair or lot size.
Statistic worth remembering: traders with strong, validated systems often see average expectancy between 0.3R and 1.0R per trade across 100 or more trades, with anything above 0.5R considered excellent. That’s your benchmark once you have enough data to trust it.
If you trail your stop to breakeven and get stopped out there, record the trade as 0R, not a negative number. The denominator locked in at entry never changes.
Expectancy, Breakeven Win Rate, and Reading Your R Distribution
Expectancy tells you what you can expect to make, on average, per trade. The formula is expectancy = (win rate × average winner in R) − (loss rate × average loser in R). That’s a real edge.
Breakeven win rate answers a different question: how often do you need to win just to avoid losing money? The formula is 1 ÷ (1 + average winner in R), and it swings hard depending on how big your winners run relative to your losers.
| Average winner size | Breakeven win rate needed |
|---|---|
| 0.5R | 66.7% |
| 1R | 50% |
| 2R | 33.3% |
| 3R | 25% |
A strategy with 3R average winners only needs to win one trade in four to break even, which is why letting winners run matters more than most new traders assume.
Reading your R distribution over time tells you more than any single trade can:
- A cluster of small positive R outcomes suggests you’re cutting winners too early.
- A long tail of −1R losses with few big wins signals a low reward setup that needs a higher win rate to survive.
- Funded trading evaluations and strategy validation both lean on this same distribution shape, not on any one lucky trade.
Converting Your Trading Journal to R-Multiples
You don’t need new software to make this switch. Two columns handle it: initial risk in dollars and outcome in R. Go back through your existing trade log, calculate the 1R for each entry using your stop distance and position size, then divide the realized profit or loss by that number.
The process is as follows:
- Pull your last 20 to 30 trades from your existing log or broker statement.
- For each one, calculate the dollar distance from entry to initial stop, multiplied by position size, to get 1R.
- Divide the realized dollar outcome by that 1R figure to get the R-multiple.
- Once every trade is converted, calculate three monthly numbers: average winner in R, average loser in R, and win rate.
- Plug those three into the expectancy formula to see whether your strategy is structurally profitable.
For scaled entries or multiple partial exits, calculate a weighted average entry price first, then treat the position as a single trade with one initial risk figure. If you moved your stop mid-trade, still use the original stop for your 1R denominator.
Pro Tip: Capture the R outcome the same day you close the trade, while entry and stop details are still fresh. Waiting until month end to reconstruct 30 trades from memory is how journals quietly become fiction.
Weekly capture, monthly calculation. That rhythm is enough to catch a drifting strategy before it costs you real money.
Common Mistakes That Wreck Your R Data
Most bad R data comes from a handful of repeat offenders, not from complicated math errors.
- Moving your stop after entry and recalculating 1R against the new stop. This quietly shrinks your average loss and inflates your apparent expectancy.
- Confusing your planned target with your realized exit. A trade you aimed for +3R but closed at +1.2R gets logged as +1.2R, not the target.
- Mixing R and percent-risk tracking inconsistently. Pick one, or track both side by side, but don’t switch mid-journal.
- Editing historical entries after the fact. Treat your initial stop and entry as immutable once logged; if you need to fix an error, note it rather than silently overwriting the number.
- Judging your system off three or four trades. A distribution needs at least 20 to 30 data points before the average R per trade means anything.
Timestamp everything at entry, not after the fact. A clean, immutable record is worth more than a clever one.
How Structured Trade Audits Turn R Data Into Fixes
Raw R data tells you the shape of your results. It doesn’t automatically tell you why your average loser keeps running to −1.4R instead of −1R, or why your win rate collapses on Fridays. That gap is where forensic trade review earns its place.
A specialized platform reconstructs uploaded trades into structured datasets specifically to expose those recurring R-loss patterns, the kind that live in the small deviations between plan and execution. Its AI Council, a group of seven specialist analysts plus a Chief Coaching Officer, debates the evidence from a trader’s history and surfaces the highest-impact behavioral and process errors rather than generic advice.
That process outputs a Kill List, a prioritized set of fixes ranked by their quantified financial impact in dollars and R. A few things this kind of structured audit typically catches:
- Stops that get moved on a specific subset of trades, quietly dragging average loser size up.
- A setup type with strong average R that gets undersized relative to its edge.
- A time-of-day or asset-class pattern where win rate drops well below the strategy’s breakeven line.
The Final Tape Academy also covers how to calculate and interpret these performance ratios directly, for traders who want to build the skill themselves before automating it.
Incorporating Risk Management Strategies With R-Multiples
R-multiples aren’t just a scoring system after the fact. They’re a sizing tool before the trade even starts. Once you know your strategy’s expectancy in R, you can back into a position size that keeps your risk of ruin low, using something like a fractional Kelly approach scaled to your actual average winner and win rate rather than a guess.
R math makes that distinction visible in a way percent-of-account risk alone doesn’t.
Daily and weekly loss limits also work better expressed in R. A rule like “stop trading after −3R in a single day” travels across account sizes and instruments cleanly, unlike a fixed dollar limit that needs recalculating every time your account grows or shrinks. The same logic applies to maximum open risk across correlated positions. If you’re running three trades in related currency pairs, each risking 1R, your total open exposure is effectively 3R if they move together, not three independent 1R bets.
Position sizing rules, daily stop limits, and correlation caps all get sharper once risk of ruin, Kelly-style sizing, and drawdown limits are all expressed in the same R unit instead of mixed dollar and percentage terms.
How R-Multiples Play Out Across Trading Styles and Assets
Scalpers and swing traders both use R, but the numbers look nothing alike. A scalper might target 0.5R to 1R winners dozens of times a day, leaning on a high win rate to generate positive expectancy.
Options traders face an extra wrinkle: theta decay and implied volatility changes mean the dollar risk on a spread isn’t always a clean stop distance the way it is on a stock or futures contract. Traders building options strategies around business cash flow often need to define 1R as the maximum loss on the structure itself, premium paid on a long option or the width of a spread, rather than a price-based stop, an approach worth understanding in more depth before applying R math to multi-leg positions.
Forex and futures traders generally have the cleanest R calculations, since pip and tick values convert to dollars in a fixed, known way. Crypto trading complicates things with wider spreads and gaps through stops, which means realized R on a losing crypto trade can sometimes run past −1R even when the stop order was placed correctly.
None of these differences change the underlying formula. They change what counts as 1R and how disciplined you need to be about honoring your initial stop distance when volatility spikes.
Where R-Multiples Fall Short
R-multiples measure the shape of your results. They don’t measure everything that determines whether your trading actually works.
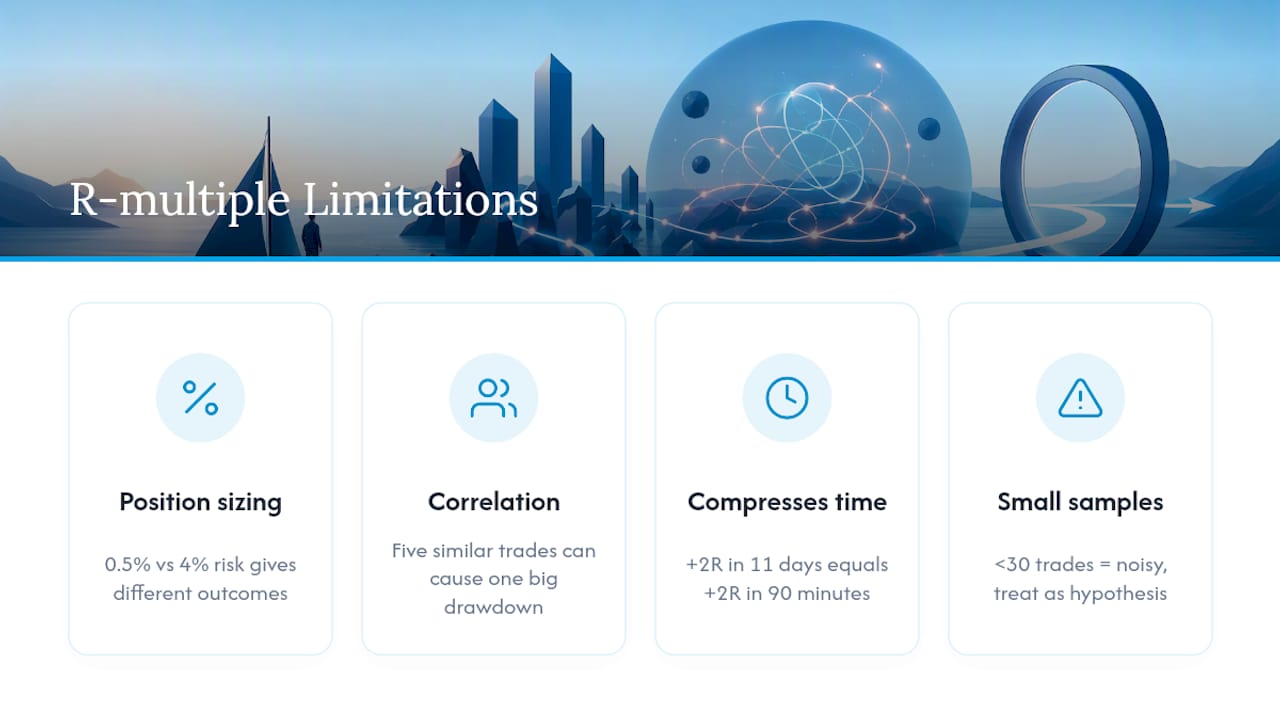
Position sizing decisions sit outside the R framework entirely. Two traders with identical +0.6R expectancy can have wildly different account outcomes if one risks 0.5% per trade and the other risks 4%, because R says nothing about how much of your capital that R represents. Correlation is another blind spot. A portfolio of five trades each showing solid individual R history can still produce a brutal combined drawdown if all five are exposed to the same underlying move.
R also compresses information. A +2R trade that took eleven days and needed constant defending against a moving thesis looks identical in your data to a +2R trade that played out cleanly in ninety minutes. If execution quality and holding time matter to your process, and they usually do, R alone won’t surface that.
Small sample sizes are the most common misuse. Ten trades showing +0.8R expectancy feels like proof of an edge, but the statistical noise in a sample that small can hide a coin flip dressed up as a system. Treat anything under 30 trades as a hypothesis, not a conclusion.
Finally, R says nothing about opportunity cost or capital efficiency. A strategy generating +0.4R expectancy on trades that tie up capital for three weeks isn’t automatically better than one generating +0.3R on trades that resolve in two days. Expectancy per trade and expectancy per unit of time are different questions.
Advanced Statistical Analysis of R-Multiple Distributions
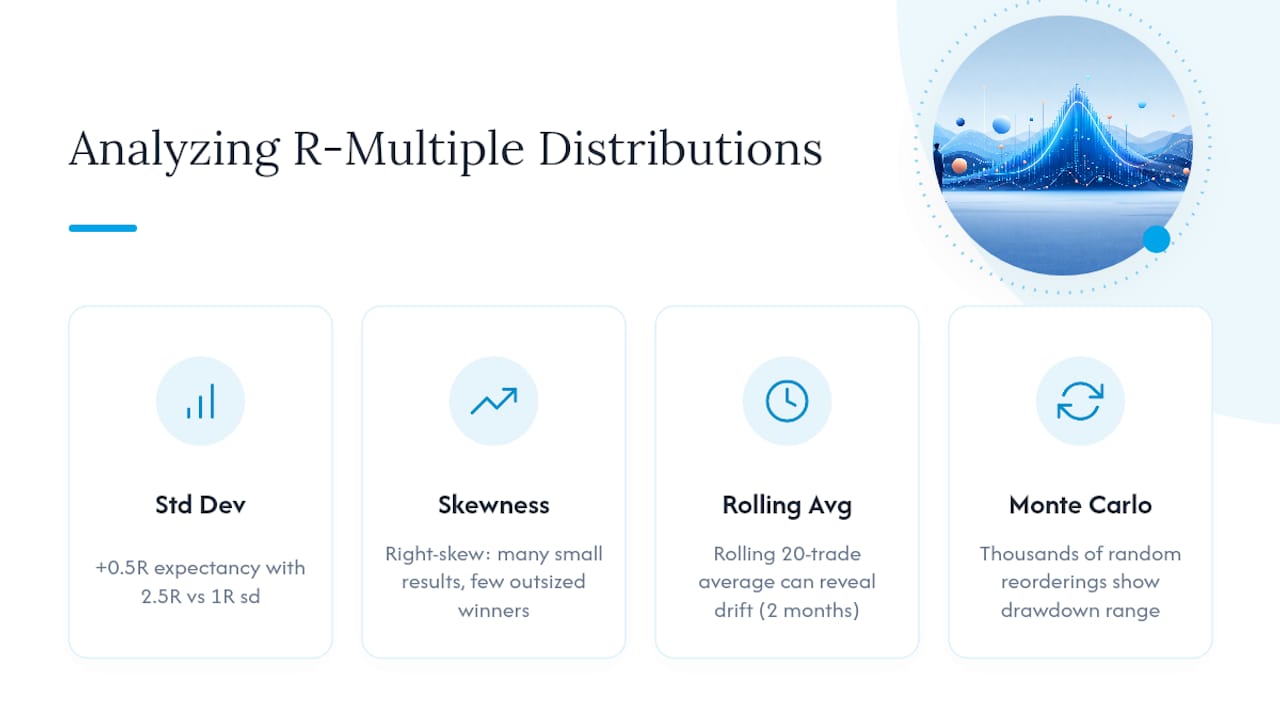
Once you have 50 or more trades logged in R, the average and win rate stop being the most interesting numbers. Standard deviation of your R outcomes tells you how much your results actually swing around that average, and a strategy with +0.5R expectancy but a standard deviation of 2.5R will feel wildly different to trade than one with the same expectancy and a standard deviation of 1R.
Skew matters just as much. A right-skewed distribution, where most trades cluster near small losses or small gains but a handful of outsized winners drive the entire expectancy, behaves very differently under psychological pressure than a symmetric distribution. Traders often quit right-skewed systems during the inevitable losing streak between outlier winners, even when the math still works.
Sequential analysis, plotting R outcomes in the order they occurred rather than as a simple average, can also expose whether performance is drifting. A rolling 20-trade average R that’s been sliding for two months tells a different story than one static number covering six months. Monte Carlo simulation, running your actual trade-by-trade R sequence through thousands of randomized reorderings, shows the realistic range of drawdowns your specific distribution could produce, which is far more useful than assuming your worst historical drawdown is your worst possible one.
What Switching to R-Only Journaling Actually Changes
The most useful shift isn’t mathematical, it’s psychological. Once trades get scored in R instead of dollars, the emotional charge around any single loss drops considerably. A −1R loss is just data confirming the plan worked as designed, not a crisis.
The behavioral changes tend to show up fast: fewer moved stops, because the initial risk becomes something you’re not tempted to renegotiate mid-trade, and cleaner position sizing decisions, because every trade’s risk is already standardized before you place it. Reviewing a month of R outcomes side by side also makes it obvious when a setup’s win rate has quietly dropped, something that’s much harder to spot staring at a raw equity curve.
Try it for 30 days. Log nothing but initial risk and R outcome for every trade, calculate expectancy at the end, and see if your read on your own performance changes.
— DigitalPunk
Turn Your R Data Into a Prioritized Action Plan
Calculating R by hand works fine for 20 trades. It gets tedious fast once you’re running 200 trades across multiple strategies and trying to spot which setup is quietly dragging your expectancy down. That’s the gap Thefinaltape is built to close.

Upload your trade history and Thefinaltape’s AI Council, seven specialist analysts plus a Chief Coaching Officer, reconstructs each trade into a structured dataset, converts outcomes into R automatically, and debates the findings to surface which specific behaviors are costing you the most money. Instead of a generic performance summary, you get a dollar-ranked Kill List showing exactly which fix would recover the most lost profit first. You can start with the free read-only inspection to see the platform before uploading anything, or move straight to a Pro subscription at $12.50 per month or $150 per year for full trade uploads and personalized analysis. Check the solutions overview to see the full breakdown of what the audit covers.
Sources
The formulas and thresholds in this article draw on a small set of trustworthy references. KenMacro’s R-multiple explainer covers the core definition and cross-asset examples in detail. CompleteTradersEdge’s expectancy grid breakdown is worth bookmarking for the breakeven win-rate math. Investopedia’s entry on multiples is useful if you want to understand how the same word gets used in company valuation.
This article is general information, not a substitute for advice from a qualified financial advisor. Consult a qualified financial professional about your own circumstances before acting on anything here.
FAQ
What Is an R-Multiple in Trading?
An R-multiple is your trade’s realized profit or loss divided by your initial risk, where 1R equals the dollar amount you risked from entry to your original stop. A trade that returns three times your risk closes at +3R; one that hits your stop closes at −1R.
What Are Trading Multiples?
The term has two distinct meanings depending on context. In company valuation, trading multiples refer to ratios like P/E and EV/EBITDA used to compare businesses. In active trading, R-multiples measure individual trade outcomes against initial risk, a completely separate concept despite the shared word.
How Do I Calculate My Breakeven Win Rate?
Divide 1 by (1 plus your average winner in R). A strategy averaging 2R winners needs to win only 33.3% of the time to break even, while one averaging 1R winners needs closer to 50%.
How Much Do Day Traders With $100,000 Accounts Make Per Day on Average?
There’s no reliable, verifiable average figure for daily profit across day traders since results vary enormously by strategy, risk per trade, and market conditions. Measuring performance in R rather than raw dollars is a more useful way to evaluate whether a specific strategy has a real edge, regardless of account size.
Can Thefinaltape Help Me Convert My Journal to R-Multiples?
Yes. Thefinaltape’s platform reconstructs uploaded trade history into structured data and calculates R outcomes automatically, then runs that data through its multi-agent AI Council audit to flag the highest-impact fixes.
Recommended
Stop reviewing from memory
Run compliance scoring, tag ranking, and Kill List rules on every trade — not once a month when the account feels off.