Traders: Size to P95 Drawdown Using Monte Carlo Backtesting
Practical Monte Carlo backtesting for traders: convert P95 drawdown and 5,000–10,000 iteration reads into position sizing, ruin limits, and clear trading...

Traders: Size to P95 Drawdown Using Monte Carlo Backtesting
Monte Carlo backtesting converts one historic equity curve into thousands of possible equity paths, so you can quantify tail risk instead of guessing at it. If the resulting drawdown or ruin numbers exceed what you can stomach, the answer is simple: cut position size, or drop the strategy. A single backtest only shows you the sequence that already happened. Monte Carlo shows you many sequences that could have happened instead.
TL;DR:
- Running thousands of simulations, ideally in the high thousands, provides stable tail risk estimates such as P95 drawdowns and ruin probabilities.
- Using the resample method captures extreme outcomes better when your backtest may underrepresent rare but damaging trade sequences.
- Block bootstrap preserves autocorrelation and is necessary for strategies that depend on trends or regime shifts, with side-by-side comparison indicating autocorrelation effects.
- Sizing decisions should be based on the P95 drawdown relative to your risk tolerance, often requiring risk reduction if the simulated tail exceeds your limits.
- Monte Carlo cannot detect overfitting or account for future market regime shifts; walk-forward analysis is essential before relying on simulation results.
Table of Contents
- What Monte Carlo Reveals That a Single Backtest Can’t
- Reshuffle, Resample, or Block Bootstrap: Which Method Fits Your Question
- How to Run a Monte Carlo Simulation on Your Backtest Trades
- What Do the Monte Carlo Numbers Actually Mean for You?
- Where Monte Carlo Breaks Down
- A Worked Example: Turning P95 Drawdown Into a Sizing Rule
- How The Final Tape Applies Monte Carlo to Real Trade Data
- A Practitioner’s Take on Monte Carlo Without the Guesswork
- Turning Simulation Output Into a Trading Decision
- Sources
What Monte Carlo Reveals That a Single Backtest Can’t
A backtest gives you one path. Reshuffle the same trades into a different order and the drawdown often looks completely different, even though the win rate, average R-multiple, and total return stay identical. That’s sequence risk, and it’s the blind spot every trader carries when they judge a strategy by its historical equity curve alone.
Run the same trade set through thousands of reorderings and resamplings, and you stop looking at one curve. You get a distribution: a fan chart showing where most paths cluster, a median outcome, and tail percentiles (P5, P95) that show the range of realistic bad luck. From that distribution you can also derive a probability of ruin and a value-at-risk (VaR) figure for a given time horizon.
This matters because backtest max drawdown is a single historical data point, not a risk ceiling. Monte Carlo simulation exposes the range of drawdowns a strategy can actually produce once you account for how differently 50 or 100 trades could have landed.
What you get out of a properly run simulation:
- An equity fan chart showing the spread between best case, median, and worst realistic case
- A P95 drawdown figure (the drawdown level exceeded only 5% of the time)
- A probability-of-ruin estimate for your account size and risk-per-trade setting
- A confidence interval around expected return, not just a single number
Statistic to remember: running only a few hundred simulations produces noisy, unstable tail estimates. Most practitioners treat thousands of iterations, typically in the mid to high thousands, as the range where P95 drawdown and ruin probability stop moving much between runs.
Reshuffle, Resample, or Block Bootstrap: Which Method Fits Your Question
Not all Monte Carlo methods answer the same question, and picking the wrong one gives you a false sense of security. Each variant stresses a different assumption buried in your backtest.
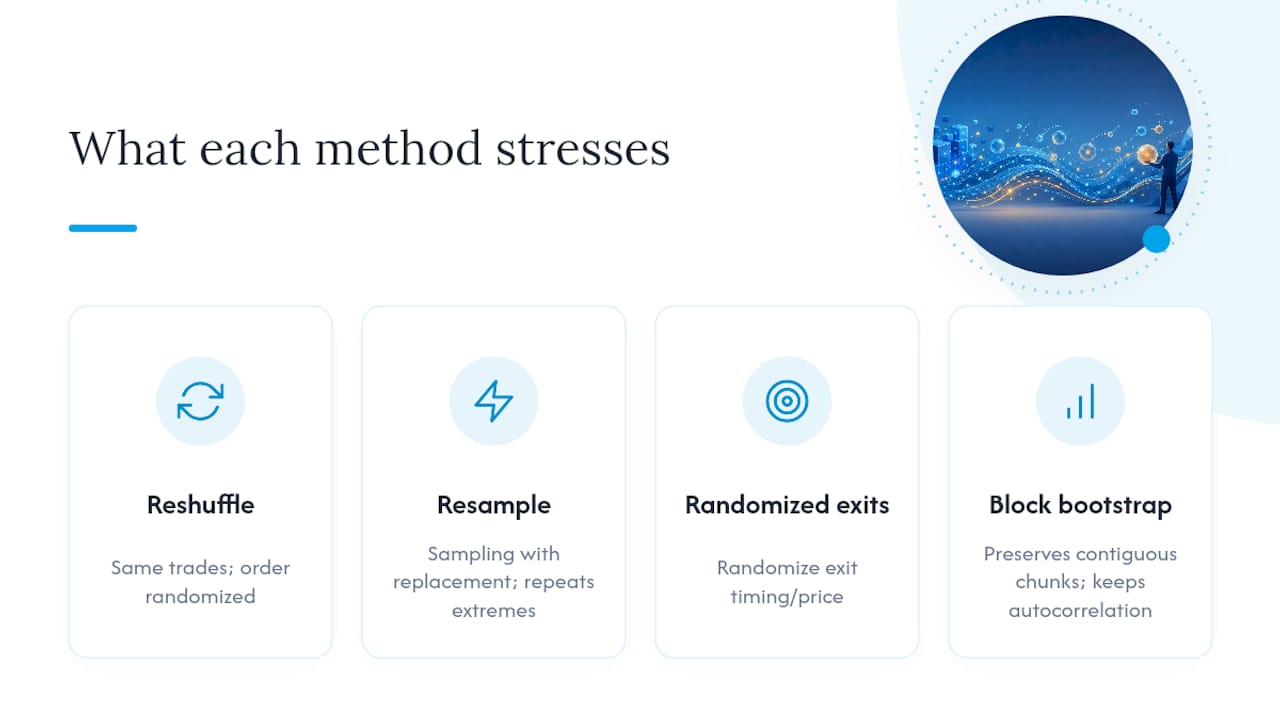
Reshuffle (permutation). This method keeps your exact trade set but randomizes the order. It isolates pure sequence risk: same trades, different luck. It won’t tell you what happens if you’d hit a run of losses worse than anything in your sample, because it can’t invent new outcomes.
Resample (bootstrap with replacement). Here you draw trades from your history with replacement, so the same big winner or big loser can show up multiple times in one simulated path. That widens your tails beyond what reshuffling alone can show, which is exactly the point. BuildAlpha’s guidance on Monte Carlo variants recommends this when you suspect your backtest sample underrepresents extreme outcomes.
Permutation with randomized exits. Instead of shuffling entire trades, you randomize exit timing or price. This stresses whether your edge survives noisy fills and catches strategies that were quietly overfit to a specific exit rule.
Block bootstrap. This preserves contiguous chunks of the trade sequence rather than shuffling trades individually, which keeps autocorrelation and volatility clustering intact. Momentum systems and anything sensitive to regime persistence need this method, because pure reshuffling destroys the serial dependence that made the strategy work in the first place.
Pro Tip: If you’re not sure whether autocorrelation matters for your strategy, run both a standard resample and a block bootstrap side by side. A big gap in the resulting P95 drawdown numbers is your answer.
How to Run a Monte Carlo Simulation on Your Backtest Trades
Getting a Monte Carlo simulation to say something useful depends less on the software you use and more on how you prepare the inputs. Here’s the sequence that actually produces a trustworthy result.
- Export trade-level data, normalized. Pull every trade as a percent return or R-multiple, not raw dollar P&L, and make sure slippage and commissions are baked into each number. A journal that treats every trade in R terms, as covered in how R-multiple discipline changes trade review, makes this step far cleaner.
- Check your sample size. Thirty trades is noisy, borderline unusable for tail estimates. Fifty to one hundred is a workable minimum. One hundred or more is what gives you percentile figures you can actually size against.
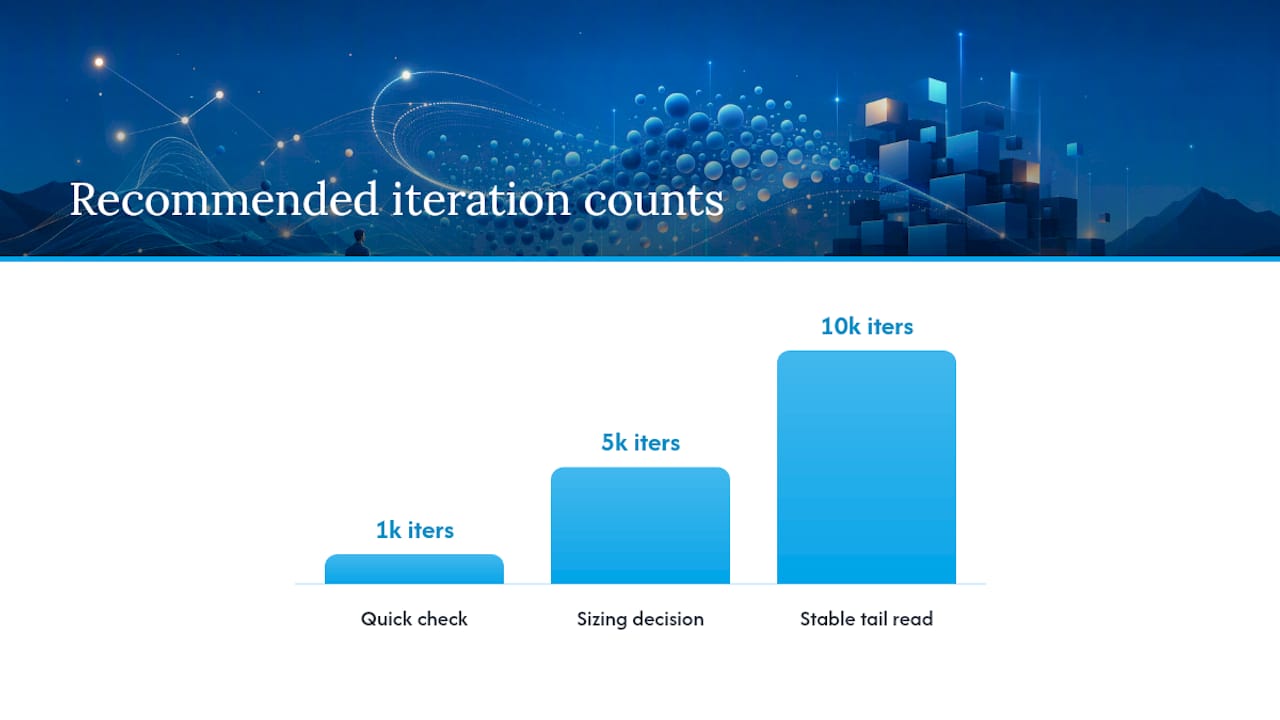
- Pick your iteration count based on the decision at hand. Run 1,000 iterations for a quick sanity check. Move to 5,000 when you’re making a real sizing decision. Push to 10,000 or more when you specifically need a stable tail-risk read, since @RISK’s own guidance recommends convergence testing to confirm your iteration count is high enough that results stop shifting.
- Set your parameters deliberately. That means starting capital, fixed risk-per-trade, a ruin threshold (commonly 50% of starting capital, though some traders use less), and the drawdown percentile you’ll size against, usually P95.
- Match the method to the question. Reshuffle for pure sequence risk. Resample when you want wider, more honest tails. Block bootstrap when your strategy depends on trends or volatility regimes holding together.
Statistic to remember: BackTestMe’s methodology treats 1,000 iterations as a rough first pass and 5,000 to 10,000 as the range for decisions you’re willing to size real capital against.
Pro Tip: Run the simulation twice with different random seeds at your target iteration count. If the P95 drawdown moves by more than a percentage point or two, your iteration count isn’t high enough yet, run it higher.
What Do the Monte Carlo Numbers Actually Mean for You?
The output is only useful once you turn it into a rule. Here’s how the core metrics translate into decisions.
Probability of ruin is the percentage of simulated paths that hit your ruin threshold before recovering. There’s no universal safe number, but many traders treat anything above 5% to 10% as reason to cut size immediately, and anything near 20% or higher as reason to walk away from the strategy entirely, regardless of how good the median return looks.
Drawdown percentiles matter more than backtest max drawdown. Sizing to the P95 drawdown rather than the single historical maximum accounts for the realistic bad luck your one backtest never happened to show you. If your backtest’s worst drawdown was 18% but your P95 across 10,000 simulated paths is 34%, size for 34%.
VaR and confidence intervals describe a range, not a prediction. A 95% VaR of 12% over 20 trades means 95% of simulated paths stayed within that loss, not that you’re guaranteed to.
The median outcome, not the best case, is your planning baseline. Half of your simulated futures land below the median. Plan around that number and the P95 drawdown together, not the cherry-picked best run.
Here’s the quick sizing math traders actually use: sizing multiplier = your drawdown tolerance ÷ P95 drawdown from the simulation. If your tolerance is 20% and the simulation’s P95 drawdown at current sizing is 40%, you’re sizing at half of what your risk tolerance supports.
Where Monte Carlo Breaks Down
Monte Carlo is a risk tool, not a validity check. It can make an overfit strategy look statistically comfortable if you skip the step that should come first.
- It cannot detect overfitting on its own. Quanthop’s framework treats walk-forward analysis (WFA) as a prerequisite, not an optional extra, because Monte Carlo will happily simulate thousands of variations of a strategy that only worked because it was curve-fit to one dataset.
- Standard reshuffling destroys autocorrelation. If your edge depends on momentum or volatility clustering, plain resampling understates real tail risk, and block bootstrap is the fix.
- Small samples produce unstable percentiles. If your P95 drawdown jumps around every time you rerun the simulation, that’s a signal you need more trades, not a bigger iteration count.
- Every simulation assumes something about win rate stability, fee structure, and market regime that may not hold going forward. Free online simulators often assume fixed-fraction sizing and independent trades, which is a simplification worth knowing before you trust the output completely.
The practical rule: if in-sample and out-of-sample performance diverge sharply, no Monte Carlo result rescues the strategy. Reject it first, simulate later.
A Worked Example: Turning P95 Drawdown Into a Sizing Rule
Say your backtest has over a hundred trades, normalized to R-multiples, and you run thousands of resampled simulations at your current risk-per-trade. The output shows a median return that looks solid, but a P95 drawdown exceeding your personal tolerance, the level where you’d realistically abandon the strategy or blow past your own risk limits.
- Read the P95 figure. In this case, 38%.
- Compute the sizing multiplier. Tolerance (20%) divided by P95 drawdown (38%) equals roughly 0.53. That means cutting your current risk-per-trade to about half.
- Re-run the simulation at the new sizing. Confirm the new P95 drawdown actually lands near your 20% target. If it doesn’t, adjust again, sizing isn’t always linear once you account for compounding effects.
- Set operational guardrails. A hard stop-loss policy, a rule to re-run the simulation whenever your live trade distribution starts shifting, and a defined trigger for pulling the strategy if live drawdown breaches your P95 estimate early.
Pro Tip: If the median return still looks attractive but the probability of ruin sits above your comfort line, reject the strategy outright. A good median with a fat left tail is exactly the setup that wipes out accounts that “backtested fine.”
How The Final Tape Applies Monte Carlo to Real Trade Data
Thefinaltape’s Monte Carlo simulator runs directly on your uploaded trade history rather than a hypothetical dataset, which means the tail-risk numbers reflect your actual execution, slippage included. The platform’s Lesson 48 walkthrough shows how a 10,000-iteration run maps out possible account futures from one trade history.
Beyond the simulation itself, Thefinaltape’s multi-agent AI Council reconstructs your trades into structured datasets and quantifies which specific errors are costing you the most money. The output includes:
- A ranked Kill List of behavioral and execution errors, each tied to a dollar figure
- Performance attribution that separates edge from luck across your trade sample
- A prioritized action plan instead of a wall of statistics you have to interpret yourself
That combination, simulation plus forensic trade review, is what turns a Monte Carlo output from an interesting chart into an actual decision.
A Practitioner’s Take on Monte Carlo Without the Guesswork
Monte Carlo backtesting earns its place only when it follows walk-forward analysis, not before. Skip WFA and you’re just simulating a curve-fit illusion with more decimal places. One habit worth stealing: rerun your simulation with a few different block lengths. If your P95 drawdown estimate stays roughly stable across block sizes, your tail read is trustworthy. If it swings wildly, you don’t have enough data yet, and no amount of iterations fixes that.
— DigitalPunk
Turning Simulation Output Into a Trading Decision
Running the simulation is the easy part. The harder part is knowing exactly which error in your execution is inflating that P95 drawdown in the first place, and that’s where a spreadsheet or a standalone simulator runs out of road. Thefinaltape connects the two: upload your trade history, run a Monte Carlo simulation on your actual data, and let the AI Council trace which specific decisions (a habit of oversizing after wins, exits cut short on winners, revenge trades after a loss) are driving the tail risk the simulation just flagged.
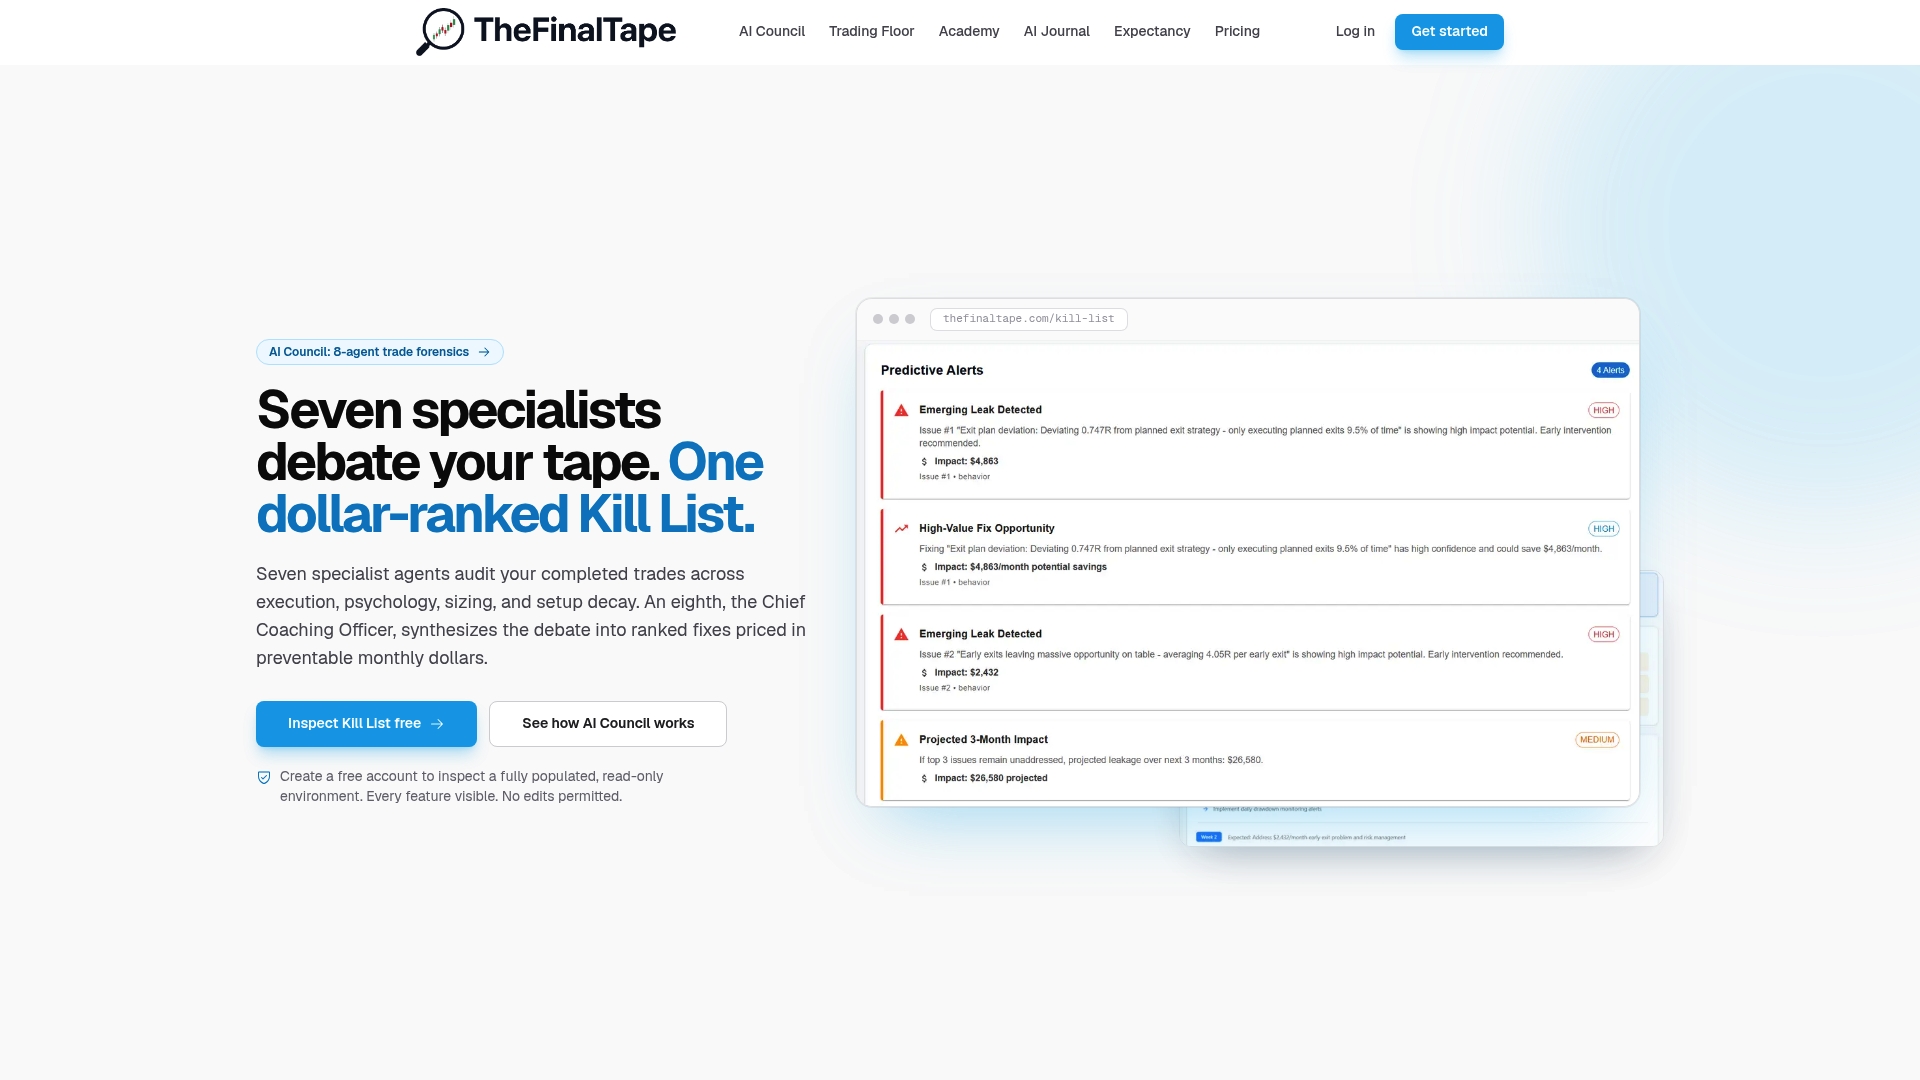
The output isn’t just a percentile chart. You get a prioritized Kill List with quantified financial impact for each error, so you know which fix actually moves your P95 drawdown and which one is noise. Pair that with the Performance Analyst agent breaking down attribution trade by trade. You’ve got a direct line from simulation output to operational change. If you’re ready to see what your own trade history says under 10,000 simulated futures, start with Thefinaltape’s trade review software and upload your history for a real audit.
Sources
- Monte Carlo Simulation - Quantify Trading Strategy Risk | BacktestMe
- @RISK Getting Started Guide (Palisade / Lumivero)
- Monte Carlo Simulation | Complete Guide and Simulator - BuildAlpha
Recommended
Stop reviewing from memory
Run compliance scoring, tag ranking, and Kill List rules on every trade — not once a month when the account feels off.