Calculate Max Risk Per Trade: Exact Dollar Math for Stocks & Futures
Turn 0.5%–2% risk rules into exact dollar limits. Step by step sizing for stocks and futures, plus trade audits that expose where your risk cap failed.

Calculate Max Risk Per Trade: Exact Dollar Math for Stocks & Futures
Most retail traders generally risk a small fraction of account equity per trade, commonly around 0.5% to 1%, while experienced traders may use a higher percentage up to 2% on strong setups. The immediate action: multiply your account balance by that percentage to get your dollar risk, then size every position backward from that number. CME Group’s 2% Rule and Investopedia’s risk management framework both treat this as the starting math for every trade you take.
TL;DR:
- Risk no more than 1% of your account equity per trade for smaller accounts, and up to 2% only if you have a proven edge and larger capital.
- Calculate dollar risk by multiplying your account balance by your chosen risk percentage, and base position size on stop-loss distance to stay within that risk.
- Use Average True Range to adjust stop-loss levels for volatility, ensuring your dollar risk remains consistent across different instruments and market conditions.
- Prop firm rules often restrict per-trade risk to 1% to 1.5% to prevent quick losses that could end evaluation prematurely, requiring more disciplined risk management.
- Regularly audit and journal trades to detect risk rule breaches and reinforce discipline, leveraging AI tools to identify where real risk exceeds planned limits.
Table of Contents
- What’s the Right Percent to Risk Per Trade?
- How Do You Calculate Dollar Risk Per Trade?
- What Does Max Risk Per Trade Look Like in Dollars?
- Should You Adjust Risk for Volatility and Instrument Type?
- How Do Prop Firm Rules Change Max Risk Per Trade?
- Pre-Trade Checklist: Avoiding Oversized Risk
- Why Journaling and Trade Audits Close the Gap Between Rules and Behavior
- Why Discipline Beats Rule-Chasing
- How Thefinaltape Enforces the Risk Limits You Already Know
- Sources
- FAQ
What’s the Right Percent to Risk Per Trade?
The 1% rule says: never put more than 1% of total account equity on the line for a single trade. Traders on small accounts, or anyone inside a prop firm evaluation, tend to gravitate here because it takes ten consecutive losers before the account takes a real hit.
It still caps risk on any single trade at 2% of equity, and traders who use it are usually chasing faster account growth or trading a strategy with a high enough win rate to justify the extra exposure.
Which one fits you depends on account size and track record, not preference:
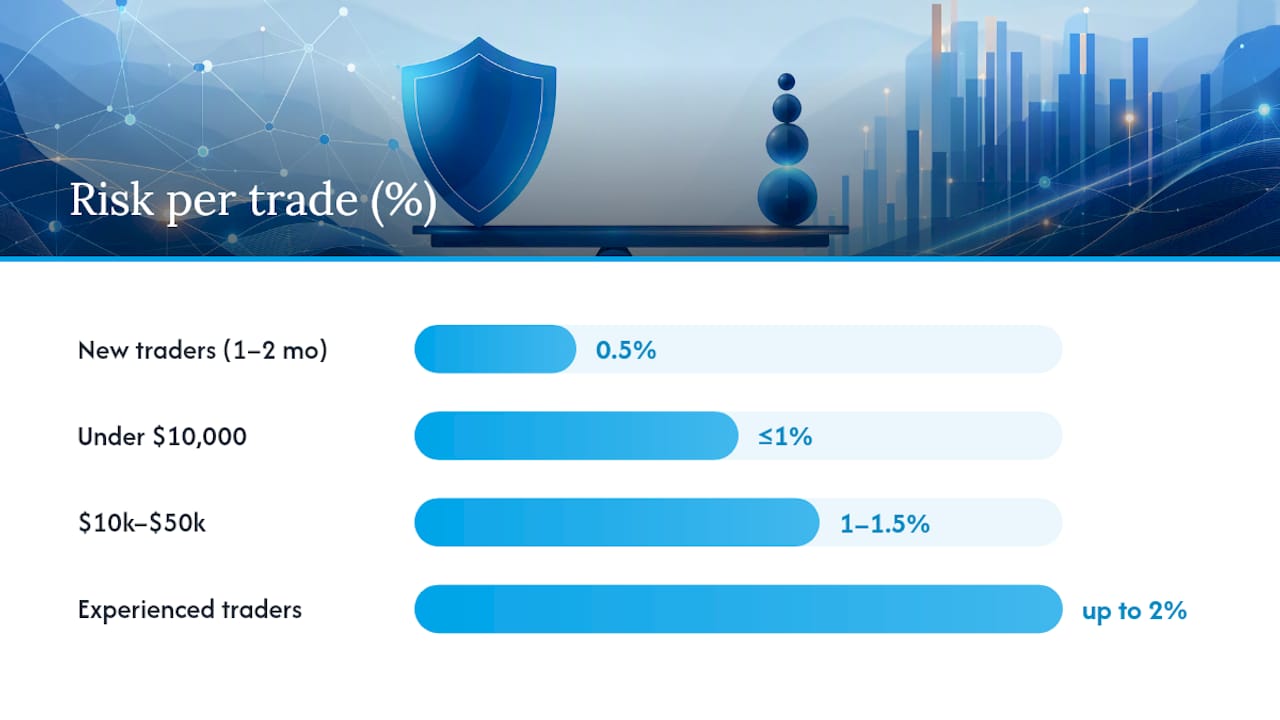
- Under $10,000: stick to 1% or lower. A string of losses at 2% can wipe out a third of the account before you adjust.
- $10,000 to $50,000 with a proven strategy: 1% to 1.5% balances growth against drawdown risk.
- Experienced traders with a verified edge: up to 2%, but rarely higher on a discretionary basis.
- New traders in month one or two: 0.5% until the strategy proves itself in live conditions.
Percentages are guidelines, not guarantees. A 2% cap reduces the odds of ruin but does nothing to stop a weekend gap or a slippage spike from turning a planned 2% loss into 3% or more.
How Do You Calculate Dollar Risk Per Trade?
The formula is simple: dollar risk = account equity × chosen risk percent. Everything else in your trade plan builds off that one number.
- Pick your risk percent. Base it on account size and experience, not on how confident you feel about today’s setup.
- Set your stop-loss. Place it at a technical level, a swing high or low, a moving average, or a distance derived from Average True Range, not at a round number that feels comfortable.
- Calculate position size. Divide dollar risk by the stop-loss distance per share, contract, or unit. That quotient is how many units you can hold.
A $20,000 account risking 1% has $200 on the line. If your stop sits $1.00 away from entry, you can hold 200 shares. If it sits $4.00 away, you can hold 50. The stop distance, not your enthusiasm for the trade, decides the size.
Pro Tip: Round position size down, never up. Commissions, spread, and slippage all eat into your planned risk, and rounding up to hit a “nice” share count quietly turns a 1% risk trade into a 1.2% or 1.3% one.
What Does Max Risk Per Trade Look Like in Dollars?
Seeing the math against real account sizes makes the abstraction concrete. Here’s how a 1% and 2% cap translate across common account balances:
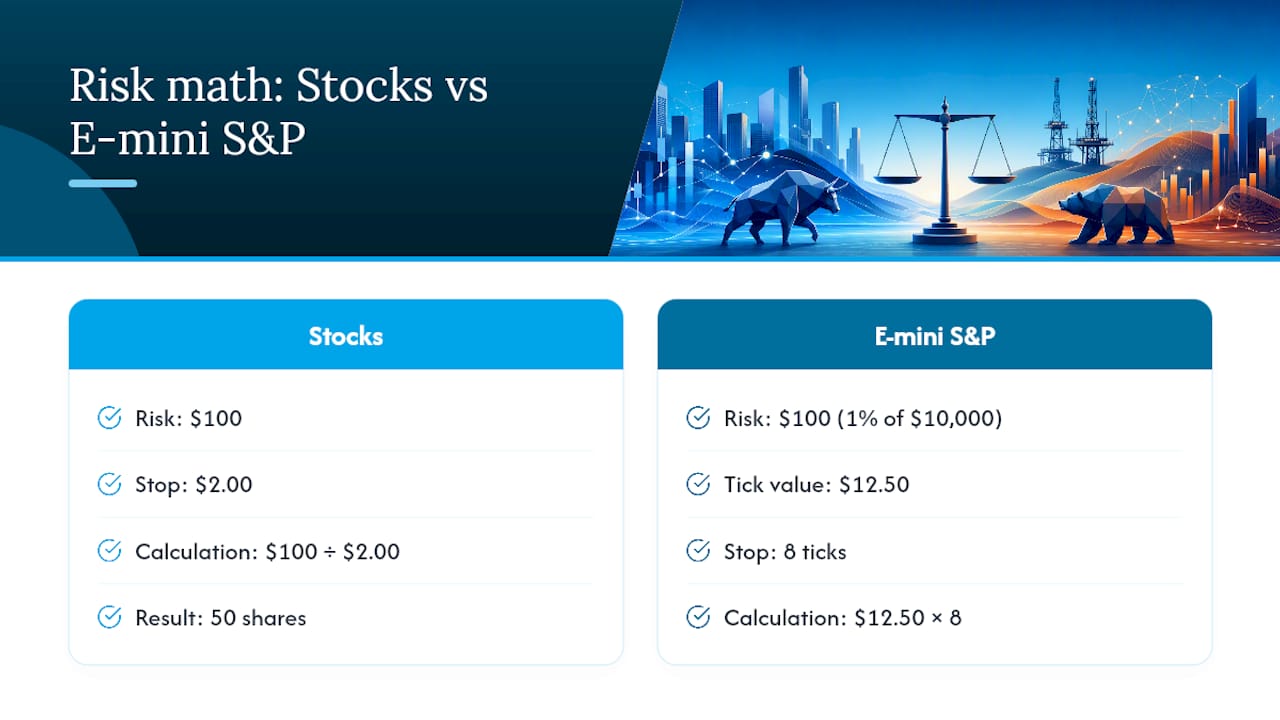
Stock example: you want to risk $100 on a trade with a $2.00 stop-loss distance. Divide $100 by $2.00 and you get 50 shares.
Futures example: on the E-mini S&P 500, each tick is worth $12.50. If your stop is 8 ticks away, that’s $100 of risk per contract. A trader with a $10,000 account risking 1% ($100) can trade exactly one contract at that stop distance, a good illustration of why tick math matters before you ever click the buy button.
Should You Adjust Risk for Volatility and Instrument Type?
Applying a flat percentage to every instrument you trade is one of the fastest ways to blow past your real risk tolerance. A $200 stop on a slow-moving blue chip and a $200 stop on a volatile small cap are not the same bet, even though the dollar figure matches.
Average True Range gives you a moving yardstick for volatility. Use it to set stop distance first, then work backward to position size so your dollar risk stays fixed even as the instrument’s swings change week to week. This is the same ATR-based scaling technique professional risk desks rely on.
A few adjustments worth building into your plan:
- Cut your percent risk for illiquid or high-volatility instruments, where slippage on entry and exit runs wider than usual.
- Allow slightly more risk on low-volatility, high-conviction setups where your stop can sit tighter and your win rate has historical support.
- Scalpers generally use smaller dollar risk with tighter, faster stops; swing traders often accept a larger equity percentage per trade because they hold through more noise.
- Halve your normal risk percent around major news releases or in markets you don’t trade often. Unfamiliarity is its own volatility.
How Do Prop Firm Rules Change Max Risk Per Trade?
Evaluation accounts operate under a different rulebook than your own capital. Most prop firms enforce a maximum daily loss, a maximum single-trade loss, and a total drawdown cap, and breaching any one of them ends the evaluation immediately, regardless of your overall profit.
FTMO-style guidance commonly recommends capping per-trade risk at 1% to 1.5% during evaluation, well below what many traders would risk with a personal account. The logic is straightforward:
- A single oversized loss can consume a large chunk of your allowed maximum drawdown in one trade.
- Lower per-trade risk buys you more attempts to hit the profit target before hitting the loss limit.
- Evaluation pressure tends to push traders toward risk levels they’d otherwise consider too conservative, and that discipline usually pays off.
Your edge doesn’t change; your margin for error does.
Pre-Trade Checklist: Avoiding Oversized Risk
Run this sequence before every entry, not just the trades that feel important:
- Confirm current account balance and your chosen risk percent for this specific trade.
- Calculate dollar risk (equity × percent) and derive position size from your stop distance.
- Verify the stop sits at a logical technical level, not an arbitrary dollar amount chosen to fit a round position size.
- Check upcoming news events, current spread, and expected liquidity for the instrument.
- Confirm the trade still makes sense after commissions and estimated slippage are subtracted from the reward side.
Watch for these red flags: increasing size right after a winning streak, revenge trading after a loss, and ignoring fees on high-frequency strategies where they compound fast. Any one of these quietly pushes your actual risk above your stated percent, even when your spreadsheet says otherwise.
Why Journaling and Trade Audits Close the Gap Between Rules and Behavior
Knowing your risk rule and actually following it on every trade are two different skills.
Structured trade forensics turn that creep into a measurable number instead of a vague feeling. A multi-agent audit approach can flag recurring percent breaches, rank them by actual dollar impact, and surface the specific setups where your risk discipline breaks down, often revealing that a handful of oversized trades account for most of the damage. Pairing that with performance ratio tracking or a Monte Carlo simulation of your actual risk settings shows you, in dollars, what a stricter cap would have saved over your last hundred trades.
Why Discipline Beats Rule-Chasing
They know it. They just didn’t follow it on the three trades that mattered most, usually right after a win made them feel invincible or a loss made them want it back immediately. That psychology is the real risk, not the percentage itself.
Chasing the “perfect” percent is a distraction from the harder work: verifying, trade by trade, that you actually did what your plan said. A 30-day journal where you log intended risk against realized risk will tell you more about your discipline than any rule debate ever will.
— DigitalPunk
How Thefinaltape Enforces the Risk Limits You Already Know
Knowing your max risk per trade is the easy part. Sticking to it across fifty trades in a volatile month is where most traders quietly fail, and most never find out by how much. An AI-based analysis system can reconstruct trades into structured data and flag exactly where realized risk drifted from the stated percent, then rank those breaches by dollar impact instead of gut feeling.
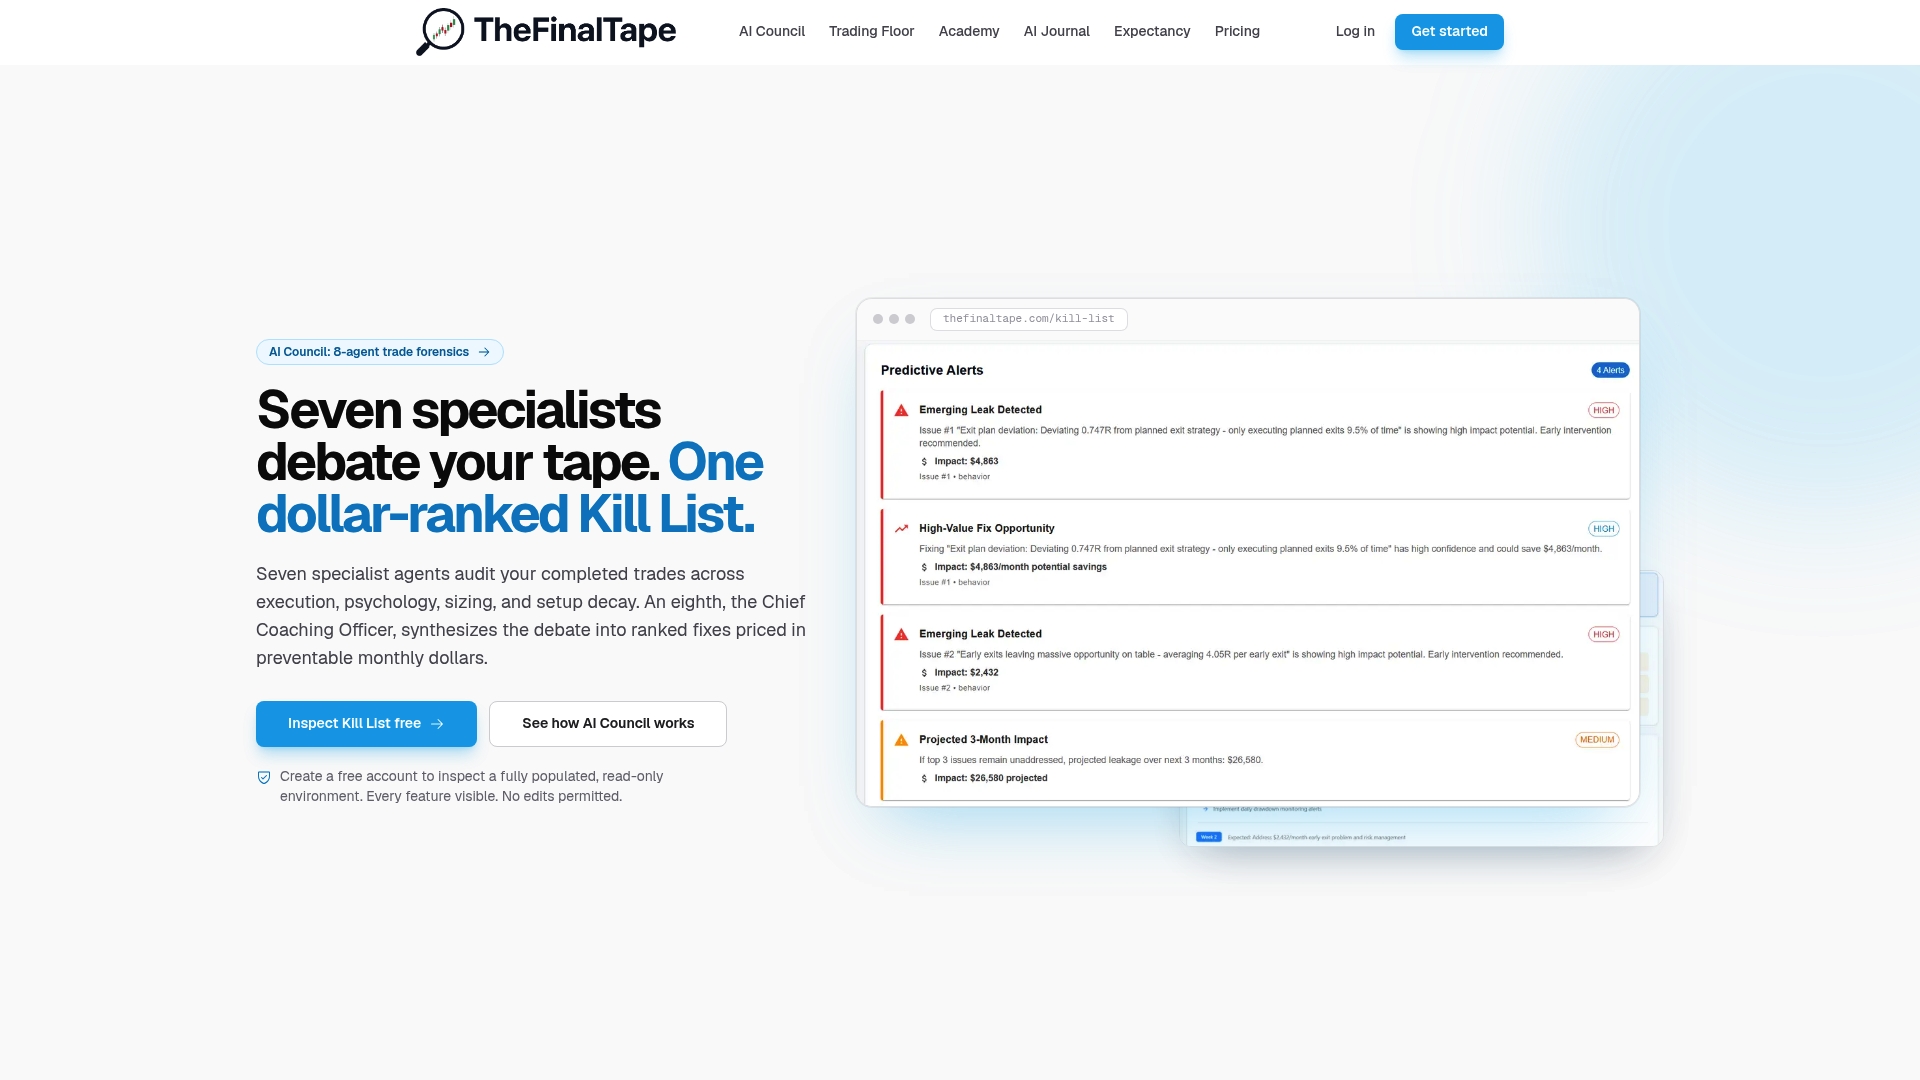
Instead of guessing whether last week’s oversized trade was a one off or a pattern, the platform’s trade review software reconciles stops, position sizes, and outcomes automatically and produces a prioritized list of the fixes worth making first. Traders working through prop evaluations or scaling a personal account can also run Monte Carlo position sizing against their own historical data to see what a stricter cap would have actually saved. For a broader tool option, TP Scanner offers AI-driven trade analysis worth comparing against your current workflow.
Start with a free platform inspection, then upload your trades and let the AI Trading Journal show you exactly where your max risk per trade rule is holding, and where it isn’t.
Sources
This article is general information, not a substitute for advice from a qualified financial advisor. Consult a qualified financial professional about your own circumstances before acting on anything here.
FAQ
Is 2% Risk Per Trade Too Much?
For an experienced trader with a verified edge and larger equity, 2% is common but sits at the aggressive end of the accepted range.
What Is the 5-3-1 Rule in Trading?
The 5-3-1 rule is a forex-focused guideline suggesting traders focus on 5 currency pairs, develop 3 strategies, and trade at 1 specific time of day. It addresses strategy focus rather than per-trade dollar risk.
Can I Risk 2% Per Trade on FTMO?
You technically can if it stays within the daily and maximum drawdown limits, but FTMO-style guidance generally recommends 1% to 1.5% per trade during evaluation, since a couple of losses at 2% can burn through a large share of your allowed drawdown fast.
Recommended
Stop reviewing from memory
Run compliance scoring, tag ranking, and Kill List rules on every trade — not once a month when the account feels off.