0.3R Rule: Expectancy in Trading That Tells When to Scale
Turn expectancy in trading into R-multiples that ignore account size. Learn the 0.3R scaling rule and use a forensic trade audit to find and fix leaks.

0.3R Rule: Expectancy in Trading That Tells When to Scale
Expectancy is the average amount you win or lose per trade, expressed as a single number that tells you whether your strategy has a real edge. Positive expectancy means your system makes money over time; negative expectancy means it’s a slow bleed no matter how good individual trades feel. As trading psychologist Van Tharp popularized decades ago, this one number matters more than win rate, more than any single trade, and it’s the first thing a forensic review through a platform like Thefinaltape should confirm.
TL;DR:
- A positive expectancy in trading must exceed 0.3R to reliably profit after costs and normal market variance.
- Expectancy in R-multiples allows comparison across different strategies and account sizes, unlike cash expectancy.
- Trust results only after analyzing at least 100 trades and comparing recent performance with long-term averages to detect regime shifts.
- Improving expectancy involves tightening entry and exit points, enforcing defined risk, and eliminating low-quality setups, tested through simulated variance.
- Outliers, unaccounted costs, market regime changes, and inconsistent journaling can quietly erode projected expectancy and should be carefully monitored.
Table of Contents
- What Is Expectancy in Trading and How Do You Calculate It?
- Three Worked Examples: Why Win Rate Alone Lies to You
- What R-Multiple Thresholds Tell You About Your Edge
- How Many Trades Do You Need to Trust Your Numbers?
- How to Improve Trading Expectancy: A Prioritized Action Plan
- Common Pitfalls That Quietly Erase a Positive Edge
- Your Three-Step Checklist for Acting on Expectancy
- Why Expectancy Alone Doesn’t Catch Every Leak
- Turn Your Expectancy Number Into a Fixable Action Plan
- Sources
What Is Expectancy in Trading and How Do You Calculate It?
The expectancy formula is simple: (Win rate × Average win) − (Loss rate × Average loss). Run those four inputs from your trade journal and you get the average profit or loss per trade, which tells you whether your strategy earns money over the long run.
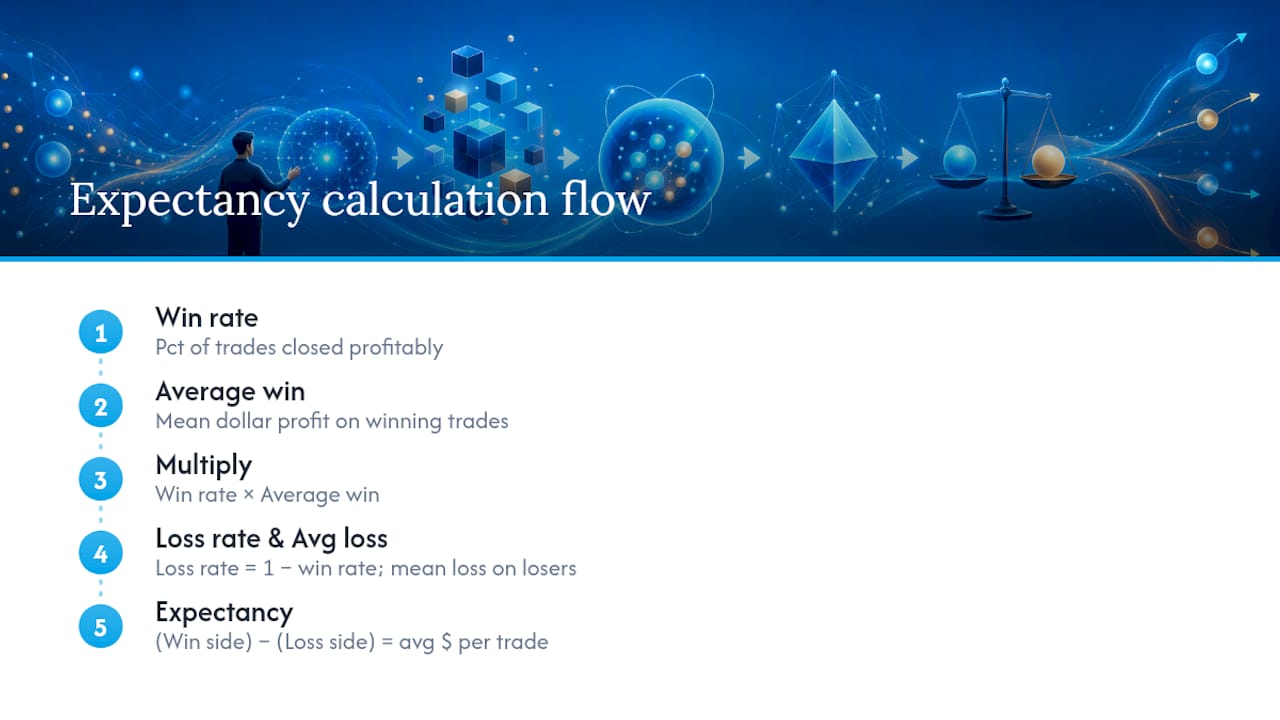
Win rate is the percentage of trades that closed profitably. Loss rate is simply 1 minus your win rate. Average win is the mean dollar profit across winning trades; average loss is the mean dollar loss across losing trades. Multiply win rate by average win, subtract loss rate times average loss, and you have expectancy in cash terms.
The problem with cash expectancy is that it doesn’t travel. A $50 average edge means something different on a $5,000 account than on a $500,000 account. That’s why serious traders convert everything into R-multiples, where R equals the amount risked on a single trade. Once expectancy is expressed in R, you can compare a forex scalping system against a swing equity strategy on equal footing, and professionals typically quote expectancy in R precisely because it strips out account size as a variable.
Three Worked Examples: Why Win Rate Alone Lies to You
Numbers make this concrete. Consider three traders risking $100 per trade over the same 100 trades.
- Trader A wins 65% of the time but averages only $80 per win against $150 per average loss. Expectancy = (0.65 × $80) − (0.35 × $150) = $52 − $52.50 = negative $0.50 per trade.
- Trader B wins just 40% of the time but averages $220 per win against $90 per average loss. Expectancy = (0.40 × $220) − (0.60 × $90) = $88 − $54 = positive $34 per trade.
- Trader C wins 50% of the time with symmetric $100 wins and losses. Expectancy = (0.50 × $100) − (0.50 × $100) = $0 per trade, a break-even system before costs.
Trader A looks impressive on a scoreboard, winning nearly two out of three trades, yet loses money over 100 trades because losses run almost twice the size of wins. Trader B looks mediocre by win rate but nets $3,400 over 100 trades and roughly $17,000 over 500. That gap between “feels good” and “actually profitable” is exactly what worked numeric examples repeatedly expose: expectancy collapses win rate and trade size into one honest number.
What R-Multiple Thresholds Tell You About Your Edge
Once you know your average R per trade (total R gained or lost across a sample divided by the number of trades), you can judge a strategy against thresholds that traders and coaches use across markets:
- Below 0R: negative expectancy. Stop trading the setup and rework entries, exits, or risk before risking more capital.
- 0 to 0.1R: technically positive but fragile. Spreads, commissions, and slippage can erase this edge entirely.
- 0.1 to 0.3R: marginal. Worth refining, not worth scaling yet.
- 0.3 to 0.5R: solid. This is where most traders start considering increased size.
- Above 0.5R: excellent. Rare, and worth protecting through disciplined position sizing rather than overconfidence.
Statistic Callout: A widely cited benchmark among trading coaches puts 0.3R as the practical minimum before scaling capital — below that, cost drag and normal variance can wipe out the edge before you notice.
Read more on converting cash P&L into R-multiple discipline in this breakdown of R-multiple review.
How Many Trades Do You Need to Trust Your Numbers?
Expectancy calculated from a handful of trades is closer to noise than signal. A few rules of thumb keep you honest:
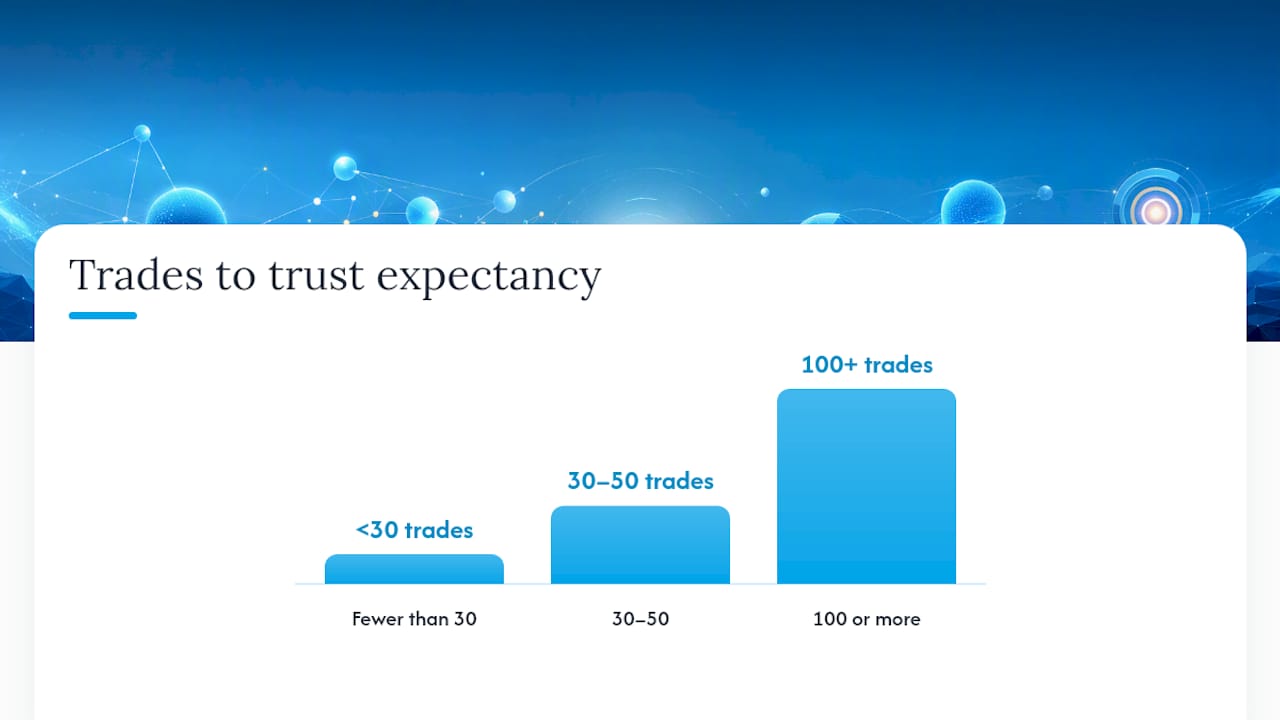
- Fewer than 30 trades: treat the number as a hypothesis, not a conclusion. Sample sizes this small are dominated by luck.
- 30 to 50 trades: a starting signal. Useful for spotting glaring problems, not for confidence.
- 100 or more trades: the threshold most professionals want before trusting a per-setup expectancy figure.
Beyond raw count, recompute expectancy on a rolling basis, comparing your last 50 to 100 trades against your lifetime average. A persistent gap between the two often signals that market conditions have shifted underneath your strategy, which is exactly the kind of regime drift that a single lifetime number will hide.
Pro Tip: Keep two expectancy figures side by side in your journal: lifetime and trailing 50 trades. When the trailing number drops well below the lifetime average for several weeks running, that’s your early warning to stop and diagnose rather than push through.
How to Improve Trading Expectancy: A Prioritized Action Plan
Raising expectancy isn’t about finding a magic indicator. It’s about fixing the specific leaks that are dragging your average trade down.
- Tighten entries and exits first. Small improvements to where you get in and where you take profit compound across every trade.
- Enforce defined risk on every position. Undefined risk is the fastest way to turn a good average win into a catastrophic average loss.
- Improve execution to cut slippage, especially in fast-moving names or during news releases.
- Cut or reweight low-expectancy setups. Practical fixes like these matter more than adding new strategies.
Test any change on paper or in a small live sample before committing real size. Once a revised setup holds a sustained expectancy above 0.3R with stable variance across at least 50 to 100 trades, that’s your signal to scale, not before.
Pro Tip: Simulate variance before you scale. A tool that runs Monte Carlo analysis on your position sizing, like this simulation approach, shows you the range of drawdowns your “positive expectancy” strategy could still produce, even when the average is genuinely favorable.
Common Pitfalls That Quietly Erase a Positive Edge
A positive expectancy number on paper doesn’t guarantee a profitable account. Several practical factors erode it before it ever hits your bank balance.
- Outlier-driven averages. One huge win can make a mediocre setup look great; inspect the full distribution, not just the mean.
- Uncounted costs. Spreads, commissions, slippage, and taxes all subtract from theoretical expectancy, and ignoring them is one of the most common calculation errors traders make.
- Market regime shifts. A setup built during trending conditions can quietly stop working in a choppy market.
- Journaling errors. Inconsistent trade records or mixing unrelated strategies into one sample muddies the entire calculation. Calculate expectancy per setup, never as one blended average.
Your Three-Step Checklist for Acting on Expectancy
Expectancy only matters if you act on it. Boil the whole process down to three moves.
- Compute it. Pull win rate, average win, and average loss from your journal and run the formula, converting to R for comparability.
- Validate it. Confirm your sample is large enough, net of real costs, and calculated per setup rather than blended.
- Decide. Stop a negative or sub 0.1R setup, iterate on 0.1 to 0.3R, and only scale capital once you clear roughly 0.3R with stable variance.
A dedicated calculator or structured trading journal removes the manual math error that quietly undermines this whole process.
Why Expectancy Alone Doesn’t Catch Every Leak
An average number can hide exactly where your money leaks out. Expectancy tells you the destination, not the route, and two traders with identical 0.3R figures can have completely different problems underneath: one bleeding on execution, the other on a single bad setup dragging down three good ones.
That’s the gap a forensic review closes. Reconstructing every trade into a structured dataset, then measuring true average wins and losses per setup rather than one blended figure, surfaces the specific decisions that are actually costing money. Ranking those errors by dollar impact, what Thefinaltape calls a Kill List, turns a vague sense of “something’s off” into a short, ordered list of fixes with a dollar figure attached to each one. That’s a different kind of accountability than a spreadsheet formula can offer on its own.
— DigitalPunk
Turn Your Expectancy Number Into a Fixable Action Plan
Running the formula by hand tells you the score. It doesn’t tell you which three trades or two habits are costing you the most money each month, and that’s the gap Thefinaltape closes for traders who want more than a spreadsheet calculation.

Upload your trade history and Thefinaltape’s platform reconstructs it into a structured dataset, calculating expectancy per setup automatically and flagging exactly where your R is leaking, whether that’s execution timing, oversized losers, or a setup that never deserved the capital it got. The trade review software ranks those errors by financial impact into a Kill List, so instead of guessing what to fix next, you get an ordered plan. For traders who want the deeper mechanics, the Setup DNA lesson walks through how per-setup expectancy analysis actually works.
Start by exploring the trading journal and analytics solutions and see what your own numbers look like once they’re properly reconstructed.
Sources
- Forex-basics
- What Is Expectancy in Trading? | Personal Trading Coach
- Trading Expectancy Explained: How to Know If Your Edge Actually Works
- Trading Expectancy Explained — Formula and How to Use It | darwintIQ
- Expectancy in trading explained: definition and meaning
Recommended
Stop reviewing from memory
Run compliance scoring, tag ranking, and Kill List rules on every trade — not once a month when the account feels off.