10% Mistake Rate Is a Red Flag. Measure Trading Error Costs
Log planned versus actual trades to convert mistakes into a dollar drag, rank errors by cost, and use a forensic audit to reclaim lost P&L.

10% Mistake Rate Is a Red Flag. Measure Trading Error Costs
Recurring small errors, a missed stop here, an oversized position there, can quietly compound into a double-digit drag on annual returns. The fix starts today: log the dollar impact of every mistake as it happens, not at month’s end. The formulas and worked examples below turn that habit into a repeatable measurement system you can run on your own trades.
TL;DR:
- Trading without a stop loss can turn a planned small loss into a much larger one, often three times the initial risk or more.
- Oversizing positions beyond your rules can double the damage from normal mistakes, especially when conviction leads to doubled risk.
- Mistakes like missing planned entries or averaging down can cause significant opportunity costs and compound into larger losses over time.
- Error rates above 10% of tagged trades indicate process issues, not market conditions, since normal operational error rates are around 1%.
- Using structured trade logs and error ranking tools helps identify and fix your most costly mistakes efficiently, reducing overall account drag.
Table of Contents
- A framework for turning mistakes into dollars
- Which mistakes cost the most, ranked
- Building a journal that tracks errors, not just P&L
- What research and regulators reveal about error frequency
- Costs that never show up in your P&L line
- The stress cost that compounds your losses
- Setting hard limits that cap error costs before they compound
- Where trading platforms help catch errors before they cost you
- How your error costs compare to professional standards
- Lessons from major professional trading error losses
- Why measuring beats guessing, every time
- Getting a forensic review of your trading errors
- Sources
- FAQ
A framework for turning mistakes into dollars
You cannot fix what you cannot measure, and most traders never convert their mistakes into a number. Before you can rank errors by cost, you need consistent categories and a few required data fields on every trade.
Start with four error categories: execution errors (wrong entry, wrong size, wrong order type), management errors (moved stop, held too long, exited too early), omission errors (missed a valid setup entirely), and process errors (skipped a rule in your plan, traded outside your defined hours). Each needs a planned outcome and an actual outcome to compute a delta.
Three formulas do most of the work:
- R-based conversion: divide the dollar loss or gain by your defined risk unit (1R) to normalize across different position sizes.
- Per-trade dollar loss formula: (actual exit price minus planned exit price) multiplied by shares or contracts, adjusted for direction.
- Monthly and annual aggregation: sum every error’s dollar delta across the period and divide by average account equity to get a percentage drag.
A worked example makes this concrete. Say you had a plan to risk 1% of a $50,000 account, or $500, on a breakout trade. The setup worked, and would have run to 10R, a $5,000 gain, but you exited early at 2R out of nerves. The missed opportunity cost is 8R, or $4,000, a real number even though no cash left your account. Now say a separate trade was sized for 1R but you doubled the position without adjusting your stop; the loss came in at 0.2R beyond plan, which on a $50,000 account with $500 as 1R equals $100 of avoidable loss. Neither event shows up cleanly in your broker statement, but both show up in a journal built to capture planned versus actual R.
To automate this, your trade log needs these exact fields: entry price, planned stop, actual stop, planned target, actual exit, shares or contracts, account equity at time of trade, mistake tag, and a free-text root cause note. With those eight fields populated consistently, a spreadsheet or simple script can compute R, dollar delta, and monthly drag without manual recalculation.

Which mistakes cost the most, ranked
Not every mistake deserves equal attention. Ranking errors by how often they happen and how much they typically cost tells you where to spend your limited fixing time first.
- Trading without a stop loss: happens on a meaningful share of undisciplined trades and can turn a planned 1R loss into 3R or more on a single adverse move, since there is no defined exit.
- Oversizing a position: common when conviction runs high; a position sized at twice your rule turns a routine 1% loss into a 2% account hit, doubling the damage from an otherwise normal mistake.
- Averaging down on a loser: adds capital to a losing thesis and frequently converts a manageable 1R loss into a 2R to 4R loss depending on how many times the trader adds.
- Missing planned entries: an opportunity cost rather than a cash loss, but as shown above, a missed 10R winner on a small account can equal several months of typical gains.
- Revenge trading after a loss: often stacks two or three impulsive trades in the same session, each carrying its own error risk on top of the original loss.
- Moving a stop further away mid-trade: converts a defined 1R risk into an undefined one, and is one of the most common ways a small loss becomes an account-threatening one.
- Overtrading beyond a plan’s frequency: raises transaction costs and increases the number of chances for any of the above errors to occur.
A mistake rate above 10% of trades tagged with an error flag is a signal that process, not market conditions, is driving your results, since research on trading-floor incidents found that roughly 1% of trades incur an operational error under normal conditions, making a 10% self-reported error rate a clear outlier worth investigating.
Small accounts feel these mistakes as tens or low hundreds of dollars per event. Larger accounts see the same behavioral errors scale into thousands of dollars per occurrence, which is why the percentage framing matters more than the raw dollar figure when comparing traders of different sizes.
Building a journal that tracks errors, not just P&L
A standard trading journal records what happened. An error-focused journal records what should have happened and calculates the gap in dollars, which is the only version that lets you prioritize fixes.
- Log planned R and actual R for every trade, alongside a single mistake tag chosen from a fixed list so you can aggregate later.
- Record the dollar delta between planned and actual outcome, using account equity at the time of the trade, not current equity.
- Calculate three KPIs monthly: mistake rate (errors divided by total trades), average dollar cost per mistake, and total lost return as a percentage of equity.
- Compare actual performance to your plan’s expected performance to isolate an efficiency ratio, since a strategy that should net 8% but delivers 3% has a 5-point gap explained mostly by execution errors.
- Rank every tagged mistake type by total dollar impact for the month to produce a simple kill list ordered from most expensive to least.
For automation, most broker CSV exports include fill price, quantity, and timestamp; a basic spreadsheet formula comparing those fields against your logged plan can flag deltas automatically, and reviewing the dashboard metrics that reveal whether you’re actually profitable gives a structured starting point for what to track.
Pro Tip: Review your kill list on the same day each month so the habit sticks, and fix only the top one or two items before moving to the next month’s list.
What research and regulators reveal about error frequency
The scale of trading errors is not a matter of opinion; it shows up in decades of academic data and in regulatory findings.
The most-active individual investors underperform benchmarks after trading costs, with frequent trading significantly reducing net returns.
That conclusion comes from a study of more than 60,000 households conducted by Barber and Odean, which found that heavy traders’ turnover and round-trip costs explained much of their underperformance relative to less active investors. Roughly 1% of trades analyzed in trading-floor incident research carry an operational error, with slips and lapses in attention identified as the leading cause rather than isolated one-off mistakes, which suggests process fixes scale better than trying to eliminate individual slip-ups one at a time.
Regulatory bodies have reached similar conclusions from a different angle. FINRA’s guidance on frequent intraday trading warns that frictionless mobile trading interfaces raise the risk of costly mistakes, citing margin exposure, elevated trading costs, and rule violations as common drivers of loss. A related SEC committee report on self-directed investors found that streamlined order-entry screens can omit risk disclosures that would otherwise prompt a trader to pause before an error-prone execution.
Beyond the retail level, institutional trade fails illustrate the same principle at a larger scale: unresolved settlement failures can generate costs far beyond the value of the original trade through financing charges and operational cleanup.
Costs that never show up in your P&L line
Your P&L statement only captures realized gains and losses, which means a meaningful share of what trading errors cost you is invisible on that single number.
Transaction costs are the most obvious hidden layer. Every extra trade generated by overtrading or revenge trading adds commissions and bid-ask spread costs that compound across a year, even when each individual trade looks small. Margin interest is a second layer: a mistake that leaves you holding a position on margin longer than planned accrues financing charges that have nothing to do with whether the trade eventually wins or loses.
Regulatory and operational failures add a third, less visible cost. Institutional research on failed trades shows that a settlement failure can generate costs ranging from a few dollars to thousands, depending on the asset class and how long the fail persists, driven by financing charges, staff time, and cleanup work rather than the trade’s original market risk. Individual traders rarely encounter a settlement fail directly, but the same principle applies at a smaller scale whenever an order error requires a broker correction or a manual adjustment.
None of these costs appear as a single labeled line item. They surface only when you track total account drag against expected performance, which is why the monthly aggregation step in your journal matters as much as the per-trade dollar calculation.
The stress cost that compounds your losses
A trading error rarely stays contained to a single trade. The stress it produces changes how you trade for hours or days afterward, and that secondary effect often costs more than the original mistake.
A trader who takes an avoidable loss frequently tightens up on the next entry, hesitating past a valid signal, or loosens up entirely and takes a low-quality setup to “make it back.” Both responses are decision failures triggered by the first error, not independent mistakes, and both carry their own dollar cost that belongs on the same ledger as the original error.
This is part of why revenge trading appears so often on cost-ranked mistake lists: it is a direct, measurable symptom of an emotional response to a prior loss rather than a standalone strategic choice. The compounding effect means a single bad trade, if it triggers a stress reaction, can produce two or three additional errors in the same session. Tracking mistake clusters, not just isolated events, in your journal helps surface this pattern, and a root cause field that notes “traded after a loss” or “traded while frustrated” turns an intangible stress cost into a taggable, countable one.

Setting hard limits that cap error costs before they compound
Risk management rules exist to put a ceiling on how expensive any single mistake can become, which matters more than trying to prevent every mistake outright.
A maximum loss per trade, expressed as a fixed percentage of account equity rather than a dollar figure, keeps position sizing errors from scaling with account growth. A maximum loss per day, set as a multiple of your per-trade limit, stops a bad morning from turning into a catastrophic session through revenge trades or oversized recovery attempts. Reviewing frameworks like the 1% rule commonly used by proprietary trading desks shows how a simple cap, consistently enforced, limits the downside of the exact mistakes ranked highest in the comparative section above.
The key design choice is making the limit mechanical rather than discretionary. A rule you can override in the moment is a rule that will get overridden precisely when emotion is highest, which is the same moment error rates spike. Hard stops placed at order entry, position size calculators that reject an oversized order, and daily loss circuit breakers that lock the platform all remove the decision from the moment of maximum risk.
Where trading platforms help catch errors before they cost you
Modern trading platforms can intercept a meaningful share of costly mistakes before they execute, if the trader configures them to do so.
Order confirmation prompts that display position size as a percentage of account equity, rather than just share count, catch oversizing errors at the point of entry. Automated stop-loss orders remove the discretionary moment where a trader might otherwise talk themselves out of an exit. Platforms with built-in daily loss limits can halt new order entry once a preset threshold is hit, functioning as the mechanical circuit breaker described above.
The same SEC committee findings that flagged frictionless interfaces as a risk factor also point to the fix: added friction at order placement, such as a confirmation screen showing risk in dollar terms, gives a trader a final checkpoint before an error becomes a loss. Backtesting tools deserve mention here too, since poor data hygiene during strategy development can bake errors into a plan before a single live trade happens; resources like the BacktestMarket blog cover common data pitfalls worth checking before you trust a backtested edge. None of this technology replaces the discipline of logging and reviewing errors, but it does lower the number of errors that reach your account in the first place.
How your error costs compare to professional standards
Without a benchmark, a mistake rate or a monthly dollar loss is just a number floating in isolation. Professional trading desks and prop firms operate under structured limits precisely because they need a comparison point for acceptable error cost.
A retail trader logging error rates above the roughly 1% baseline found in trading-floor incident research is operating well outside what institutional environments treat as normal operational friction. Professional desks typically enforce daily and per-trade loss limits precisely because unmanaged error costs compound faster than most traders expect, and those limits function as an informal industry benchmark even where no single public standard exists for retail accounts.
The most useful benchmark for an individual trader is not a universal number but a personal one: your own strategy’s expected return, tracked against your actual return, month over month. The gap between the two, expressed as a percentage of equity, is your true error cost, and it is the number worth comparing against your own history rather than against another trader’s account size or strategy.
Lessons from major professional trading error losses
Professional trading desks have produced some of the clearest illustrations of how a single execution error can escalate into a large loss when risk controls fail to catch it in time.
These events share common threads with the retail-level mistakes covered earlier: a sizing or entry error compounded by a slow or absent circuit breaker, turning what should have been a contained loss into a much larger one. The human-factors research on trading-floor incidents found that situation awareness failures and breakdowns in team communication, not isolated technical glitches, were the dominant causes behind these kinds of escalations. That finding reinforces a theme running through this entire guide: the fix that scales is a structural one, mechanical stops, hard position limits, and mandatory review checkpoints, rather than relying on individual vigilance in the moment an error is happening.
The lesson for an individual trader is proportional rather than literal. You will not lose millions in 28 minutes on a retail account, but the same structural gap, no mechanical stop, no daily limit, no review checkpoint, is what turns a small, forgivable mistake into an account-threatening one at any size.
Why measuring beats guessing, every time
Most traders overestimate how much a big loss cost them and dramatically underestimate how much their small, recurring mistakes add up to over a year. The dollar framework above exists to correct that blind spot, not to add busywork to your routine.
A simple first month works like this: log every trade’s planned versus actual R without exception, tally the total dollar cost of tagged mistakes at month’s end, and pick the three most expensive error types to fix before adding anything else to your rules. Discipline built on a number beats discipline built on a feeling.
— DigitalPunk
Getting a forensic review of your trading errors
Building the journal and formulas above by hand works, but it takes hours every week that most active traders would rather spend trading or reviewing setups. A forensic audit compresses that work into a structured report you can act on immediately.
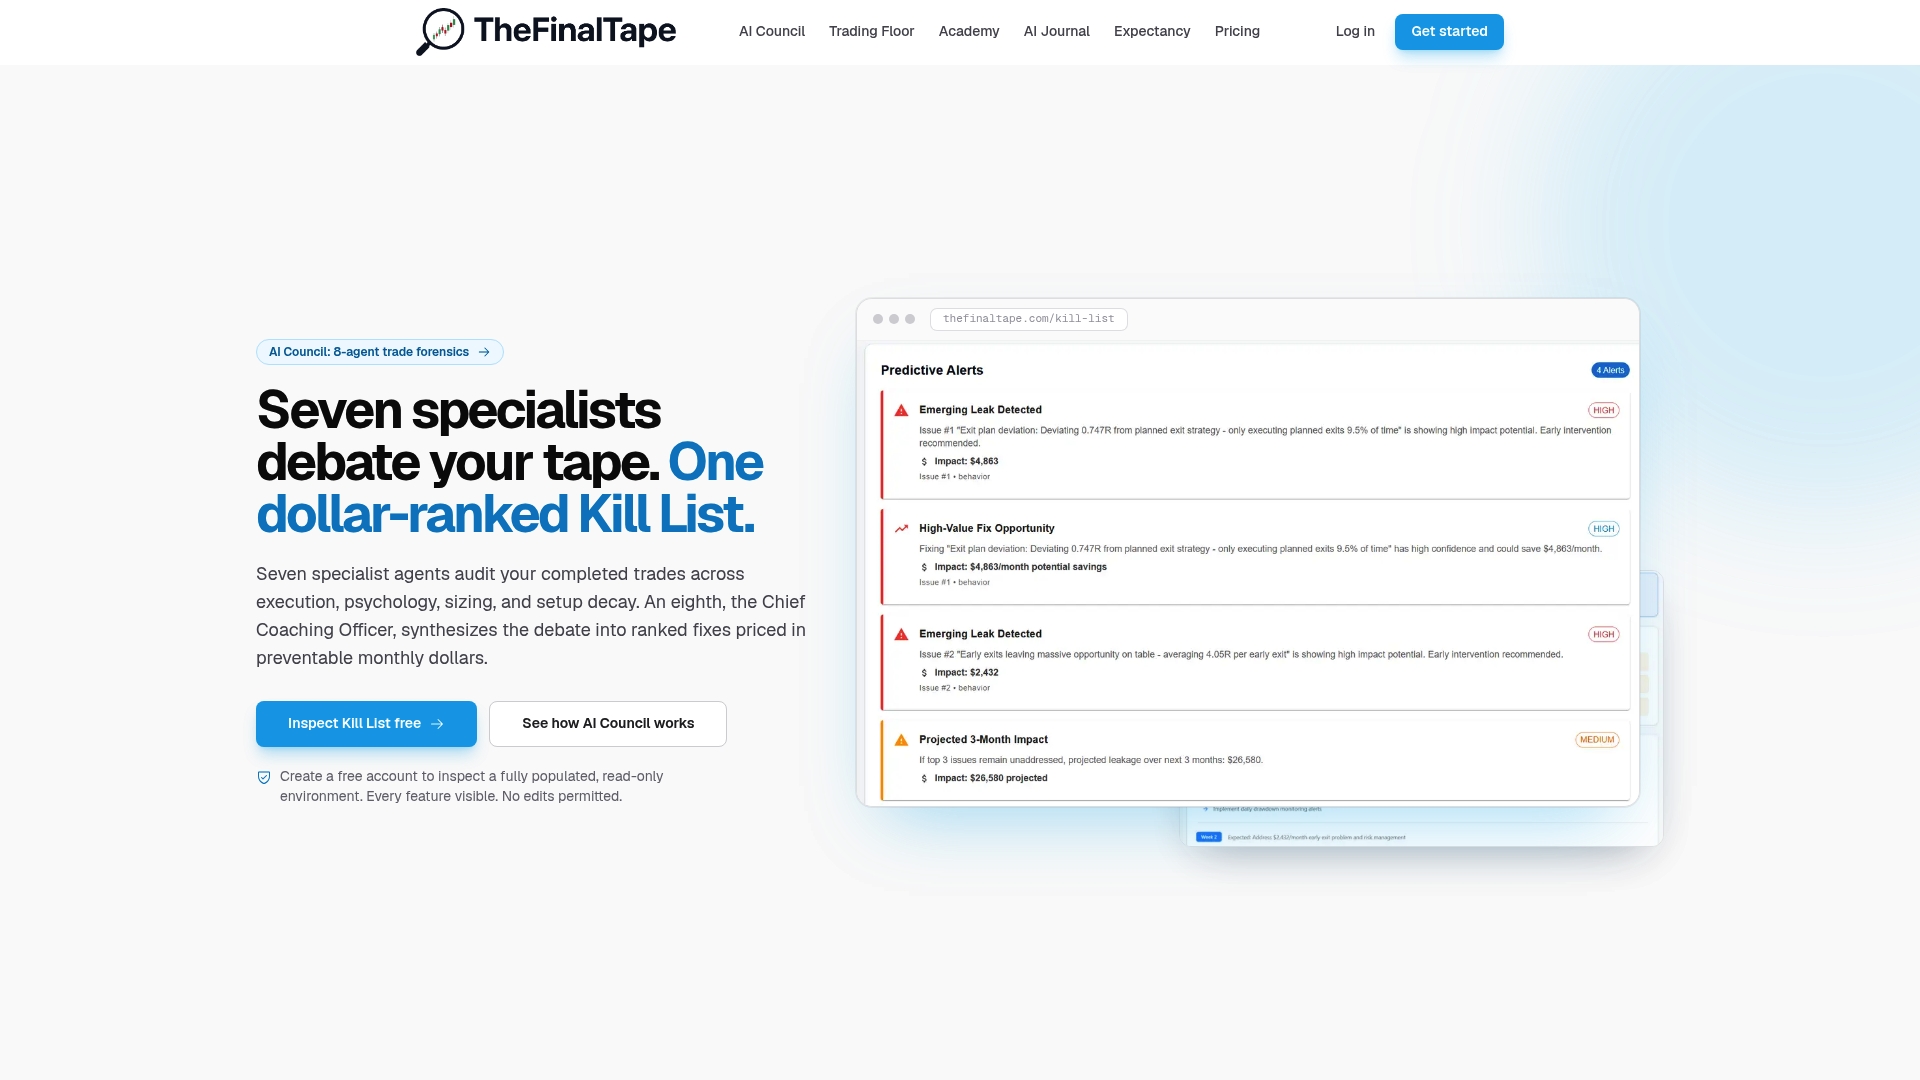
A specialized service reconstructs trade histories into structured datasets and applies a multi-agent AI Council that debates the evidence and produces a prioritized list ranking mistakes by dollar impact. This review is designed for traders seeking measurable, accountability-backed fixes rather than generic mistake checklists.
| What you get | Detail |
|---|---|
| Structured trade dataset | Trade history reconstructed into planned versus actual outcomes |
| Prioritized Kill List | Mistakes ranked by quantified dollar impact |
| Action plan | Accountability-backed fixes tied to the data |
The Pro plan runs $12.50 per month or $150 per year, and a Read-Only Inspection tier is available for traders who want to look under the hood first. Start with the trading journal and analytics platform to see how your own numbers stack up.
Sources
- Individual Investor Trading and Returns (Barber & Odean)
- Human factors in financial trading (FINANS study)
- Frequent intraday trading: understanding the basics | FINRA
- Protection of self-directed investors when trading complex products (SEC committee report)
FAQ
Is it true that most traders fail to beat the market?
Academic research on active individual investors, including the Barber and Odean study of over 60,000 households, found that the most frequent traders significantly underperformed benchmarks once trading costs were factored in. The exact share of traders who fail varies by definition and market, so treat any single percentage claim with caution rather than as an established industry-wide figure.
What counts as a trading error?
A trading error is any deviation between your planned trade and what you actually executed, including oversizing a position, skipping a stop loss, entering late, or exiting outside your plan. It also covers omission errors, such as skipping a valid setup entirely, since the resulting missed gain carries a real, calculable opportunity cost.
What is the 3-5-7 rule in trading?
Treat it as one example of a hard position-sizing framework rather than a universal standard, since no single regulator or academic source defines it uniformly.
How much can small trading mistakes cost over a year?
Small, recurring mistakes like modest oversizing or a slightly late exit compound month over month, and tracking them with an R-based journal often reveals a total dollar drag that surprises traders who only look at their overall P&L. The exact figure depends entirely on your account size, trade frequency, and mistake rate, which is why the measurement framework above focuses on your own numbers rather than a generic benchmark.
How do I start measuring the cost of my own trading errors?
Begin by logging planned versus actual R on every trade, tagging each deviation with a mistake type, and calculating the dollar delta using your account equity at the time of the trade. Reviewing that log monthly and ranking mistakes by total dollar impact, sometimes called a kill list, shows you exactly which fixes will recover the most money first.
Recommended
Stop reviewing from memory
Run compliance scoring, tag ranking, and Kill List rules on every trade — not once a month when the account feels off.