Fix Your $4,000 Trading Leak with AI Trading Analytics for Traders
Turn closed trades into action. Audit-first AI trading analytics computes deterministic PnL and ranks your costliest leaks by dollar impact.

Fix Your $4,000 Trading Leak with AI Trading Analytics for Traders
AI trading analytics turns your charts and trade fills into a repeatable trade plan and a ranked list of what’s actually costing you money. The real value isn’t the pattern recognition, it’s what happens after the trade closes: your entries get sharper, your worst habits get quantified in dollars, and you stop guessing why your equity curve stalls. Test this yourself before trusting the marketing. Run one graded chart through a demo, or upload a batch of closed trades, and see whether the output is a deterministic number or just a confident-sounding paragraph.
TL;DR:
- AI trading analytics provides concrete, verifiable metrics such as realized PnL, MFE/MAE, and exit efficiency based on actual trade fills, not just AI-generated text.
- Reputable tools should offer transparency with raw calculation inputs, provenance for confidence scores, and solid integrations with trading workflows, while protecting privacy.
- The most valuable insights come from post-trade reconstruction and ranked leak lists, highlighting the largest behavioral costs in dollar terms rather than general chart patterns.
- Focusing on identifying and fixing your biggest dollar-impact leaks yields faster growth than relying solely on predictive signals or pattern recognition.
- An effective audit-first system involves structured trade reconstruction, multi-agent debate, and actionable ranked error lists, not just pattern matching or general commentary.
Table of Contents
- What Does AI Trading Analytics Actually Do?
- What Features Separate Real Analytics From a Chatbot With Charts
- How AI Fits Into Your Trading Workflow
- How to Evaluate an AI Trading Analytics Tool
- What an Audit-First Approach to Trading Analytics Looks Like
- The Gap Between What AI Trading Tools Promise and What They Deliver
- See Your Trading Leaks Ranked by Dollar Impact
- Sources
- FAQ
What Does AI Trading Analytics Actually Do?
Strip away the buzzwords and AI trading analytics does two jobs: it reads charts before you trade, and it audits your fills after you trade. Both outputs need to be concrete enough to act on, not just descriptive.
On the chart-reading side, a decent tool identifies structure: support and resistance zones, classic patterns like triangles or head and shoulders, and an overall market bias (trending, ranging, or transitioning). From there it builds an actual trade plan, not just commentary. That plan should include:
- A defined entry zone tied to price structure, not a vague “buy here” arrow
- A structural stop placed at a level that would genuinely invalidate the setup
- Multiple profit targets with a stated risk-to-reward ratio
- A “bear case,” meaning the scenario where you’re wrong and what it looks like on the chart
There’s an important distinction between a scanner and an analyzer. A scanner sweeps hundreds of tickers looking for candidates that match a pattern. An AI trade analyzer grades the one setup already in front of you, an A through F letter grade or similar confidence read on the specific chart you’re staring at. You need both, but they solve different problems: one finds ideas, the other stress-tests the idea you already have.
Then there’s account-level analytics, the part most retail tools skip. This is where a system ranks your behavioral leaks, calculates performance attribution across setups, and reports metrics like MFE/MAE (maximum favorable/adverse excursion), win rate, and exit efficiency. That layer is where measurable improvement actually starts.
What Features Separate Real Analytics From a Chatbot With Charts
Plenty of apps will describe your chart in plausible-sounding English. Fewer will give you a number you can verify. Here’s what to check for during any trial.
- Deterministic metrics computed from fills, not generated text. PnL, R-multiples, and MFE/MAE should come from math run against your actual trade data, the same inputs always produce the same output. Free-form AI commentary, by contrast, can vary run to run, which is fine for color but dangerous for grading your edge.
- Confidence scores with visible provenance. A tool should tell you not just “buy zone: $142 to $144” but what fed that number: price structure, volume, a technical indicator, or a blend. If it can’t show its work, treat the output as a suggestion, not a verdict.
- Multi-agent or modular analysis. Serious platforms split the work: a price-action agent reads structure, an options-flow agent reads positioning, a sentiment agent reads news or social data. Then the outputs get reconciled instead of blended into mush.
- Backtesting and strategy validation. Any entry rule worth trading should be testable against historical data before you risk real capital on it. Look for tools that let you stress-test a rule set across multiple market regimes, not just the last six bullish months.
- Integrations that fit your actual workflow. Broker API connections, CSV import for manual journaling, and exportable PDF or CSV reports for tax season or team review all matter more once you’re past the demo stage.
- Privacy controls over what gets sent externally. If the tool calls a large language model to summarize your trades, you should be able to see, and control, what data leaves your account. Microsoft’s own privacy statement is a useful baseline for understanding how consent and data controls typically work when a service processes your inputs through an external model.
Pro Tip: Ask any vendor to show you the raw calculation behind one metric, like a single trade’s MFE, before you trust the dashboard summary. If they can’t reproduce it on request, the number isn’t deterministic. It’s decorative.
Most tools nail one or two of these six items. The ones worth paying for nail at least four.
How AI Fits Into Your Trading Workflow
The mistake most traders make is treating AI analytics as a single event, run the chart, get an answer, done. It’s actually three separate jobs spread across the life of a trade.
Before you enter, use a grader or analyzer to force the bear case. It’s easy to talk yourself into a setup when you’ve already fallen in love with the long side. A tool that spits out the invalidation scenario alongside the bullish one adds friction exactly where you need it, right before you click buy.
While the trade is open, the job shifts to position intelligence: alerts on structural stop violations, momentum shifts, or volume anomalies that suggest the original thesis is decaying. This isn’t about micromanaging every tick, it’s a real-time sanity check before you add size to a trade that’s already going against the plan.
After the trade closes, the real analytics work begins:
- Trade reconstruction turns raw fills into a structured dataset (entry time, exit time, size, slippage)
- A ranked leak list surfaces your costliest habits by dollar impact, not just by frequency
- Monte Carlo simulation tests how different position-sizing rules would have affected your equity curve across thousands of randomized sequences. That last one matters more than it sounds. A Monte Carlo sizing test can show you that a strategy with a 55% win rate blows up your account at 3% risk per trade but survives comfortably at 1%, a finding no single backtest run will reveal because sequence-of-returns risk hides inside the averages.
How to Evaluate an AI Trading Analytics Tool
Skip the feature list and ask sharper questions during any trial. Here’s a checklist that separates tools built on real math from tools built on confident language.
- Ask for a sample calculation. Request the raw inputs and formula behind one output, an R-multiple or an MFE figure, and confirm you can reproduce it by hand. If the vendor can’t walk you through it, the metric isn’t deterministic.
- Demand confidence bands, not just confidence claims. A tool that says “78% probability” without showing what feeds that number is guessing with extra steps. Reputable systems attach provenance to every score.
- Find out how low-confidence findings get handled. Are they suppressed, flagged with a caveat, or shown with the same weight as high-confidence ones? A tool that treats every output the same regardless of certainty will eventually cost you.
- Confirm real integrations. Broker API sync, CSV import, and export formats that fit your accountant’s or your team’s workflow matter once you’re past the free tier.
- Estimate the ROI before you commit. A useful trial produces at least one leak-to-dollar estimate you can weigh against the subscription cost. If your biggest behavioral leak costs you $4,000 a quarter and the tool costs $600, the math does itself.
Before signing up for anything paid, request three specific artifacts: one graded chart export, one ranked leak list from a sample trade batch, and one Monte Carlo sizing report. A moderate share of retail trading losses in behavioral studies get attributed to a small number of repeat errors, oversized losers, revenge trades, exiting winners too early, which is exactly why a ranked list beats a generic dashboard. If a demo can’t produce those three things, it’s a chart viewer with a marketing budget, not an analytics platform.
What an Audit-First Approach to Trading Analytics Looks Like
Most AI trading tools stop at pattern recognition. An audit-first approach starts where those tools stop: after the trade is already closed, when the fills tell you the truth regardless of what you meant to do.
The process begins with reconstruction. Raw fill data, entry price, exit price, size, timestamps, gets rebuilt into a structured dataset. From that dataset, deterministic metrics get computed: realized PnL, MFE/MAE, exit efficiency, R-multiples. None of that is generated by a language model. It’s arithmetic against verified fills, which means it doesn’t change if you ask the same question twice.
Once the numbers exist, a multi-agent review process, sometimes called an AI Council, has specialist analysts debate what the data means. One agent might flag oversized risk on a losing streak, another might flag premature exits on winners, and a Chief Coaching Officer role synthesizes the disagreement into a single ranked action plan. The output is typically:
- A Kill List: your costliest recurring errors, ranked by dollar impact, not by how often they happen
- Performance ratios and missed-trade reports that show what you left on the table
- An emotional-error tracker that separates plan deviations from legitimate adjustments
On privacy, the core math (PnL, MFE/MAE, R-values) stays computed internally against your fills. Only summary text, not raw account data, needs to go anywhere near an external model for the coaching narrative, and that should be a setting you control, not a default you discover later.
Pro Tip: If a Kill List item shows up worth $200 across your history, don’t touch it yet. Fix the $4,000 leak first. Ranking by dollar impact only works if you actually follow the ranking.
The Gap Between What AI Trading Tools Promise and What They Deliver
Here’s what the industry doesn’t say out loud: most AI trading tools are pattern-matching engines wearing a coaching costume. They’ll tell you a setup “looks bullish” with real confidence, but confidence isn’t the same as being right, and a model trained on historical price action has no idea a Fed announcement is about to reprice the entire tape in thirty seconds. Overfitting is the quiet killer here, a backtest that looks flawless on five years of data can fall apart the moment market structure shifts, because the model learned the noise, not the signal.
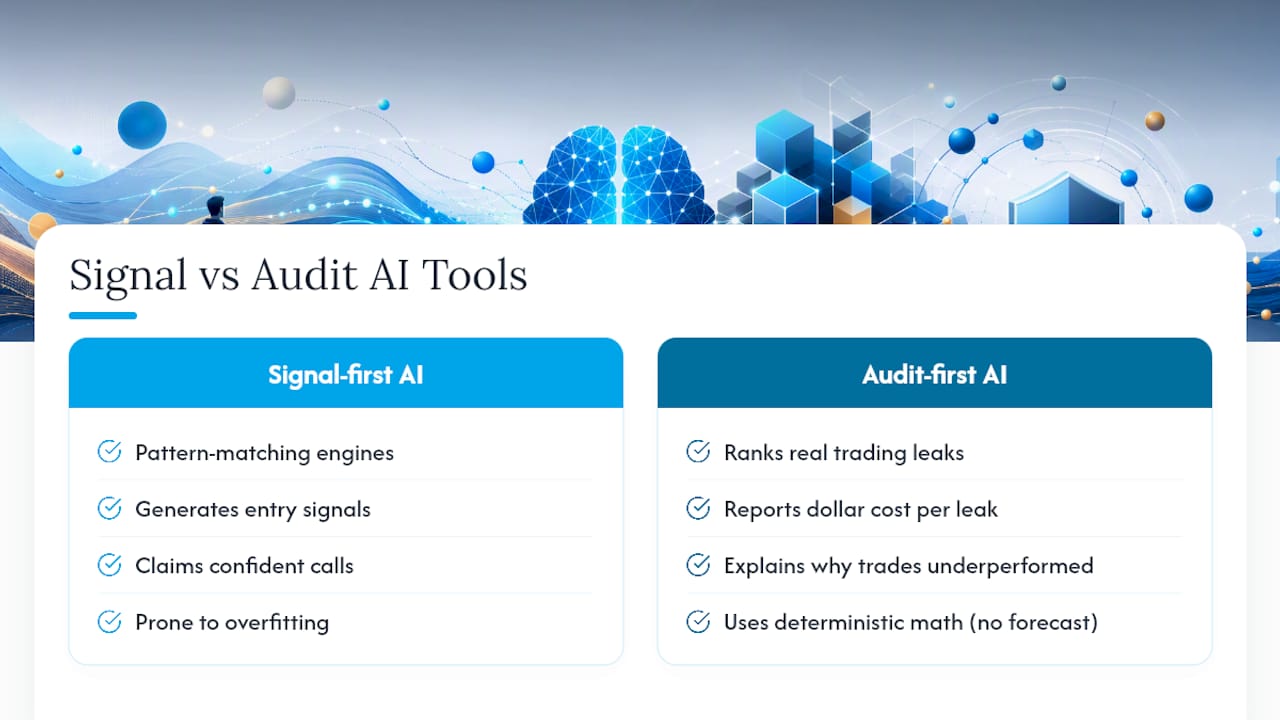
The conventional advice, “let AI find your trades,” gets the emphasis backward. Entry signals are commodity output at this point, plenty of apps generate them. What’s actually scarce is a system that tells you, with numbers, why your last twenty trades underperformed your backtest. That’s a data problem, not a prediction problem, and it’s solvable with deterministic math today, no forecasting required.
If you take one thing from this, prioritize the audit over the signal. A tool that ranks your real leaks by dollar cost will improve your results faster than one more indicator promising to call the next move.
— DigitalPunk
See Your Trading Leaks Ranked by Dollar Impact
Most chart apps stop at “here’s a pattern.” Thefinaltape starts after the trade closes, where the money actually gets lost or saved. Its AI Council runs eight specialist agents against your reconstructed fills, debates what went wrong, and hands you a ranked Kill List with each fix quantified in dollars, not vague advice to “manage risk better.”
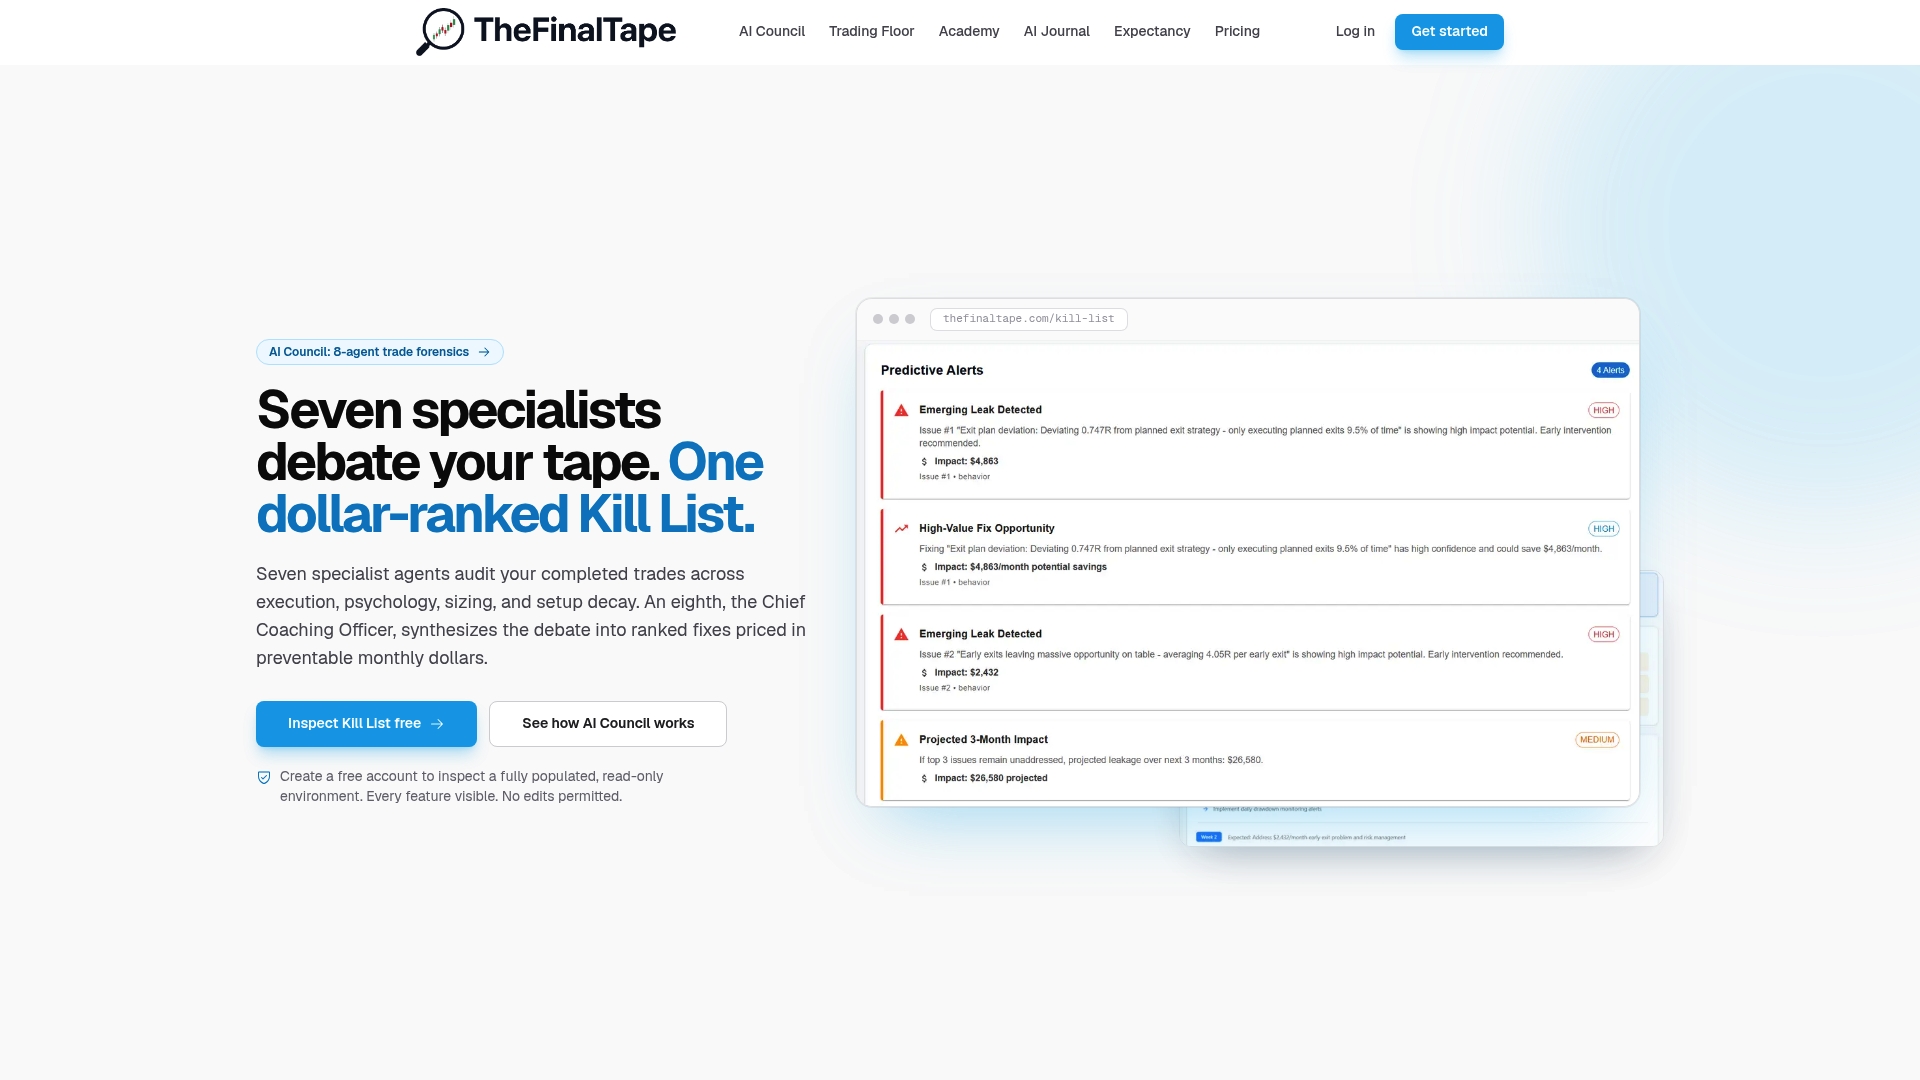
A demo request should get you three things immediately: a reconstructed trade dataset with deterministic PnL and MFE/MAE, a ranked leak list from your own trade history, and a sample coaching narrative from the AI Council. If you’re running a desk or trading with partners, the team workspace adds a live blotter so everyone sees the same numbers in real time.
Start with the free read-only inspection to see how the platform structures your data before committing to anything. When you’re ready to upload real trades and unlock the full AI trading journal, the Pro tier opens personalized analysis, the full analytics suite, and team tools. Try the trade review software with your last quarter of trades and see what your own Kill List looks like.
Sources
Microsoft’s privacy statement covers how consent and external data processing typically work. Thefinaltape’s AI trading journal and trade review software pages detail ranked forensics and reconstruction. For indicator selection, see this partner guide on volatility indicators.
- Privacy Statement - Microsoft
FAQ
What Is the Best AI Analysis for Trading?
The strongest tools separate deterministic metrics (PnL, MFE/MAE, R-multiples computed from your actual fills) from generative AI commentary, so you can trust the numbers and use the narrative as context, not gospel. Look for one that ranks your errors by dollar impact rather than just describing your chart patterns.
Does AI Trading Actually Work?
AI trading analytics works reliably for pattern detection, trade reconstruction, and post-trade auditing because those are math and classification problems with verifiable outputs. It works far less reliably for predicting future price direction, since markets react to news and sentiment shifts no historical model fully captures.
Can ChatGPT Build a Trading Bot?
ChatGPT can generate the code framework for a trading bot, order logic, indicator calculations, backtesting scripts, but it can’t guarantee the strategy is profitable or robust across different market regimes. Any bot built this way still needs rigorous backtesting and forward-testing before real capital touches it.
Is There a Free AI Trade Analyzer Available?
Several free tools let you upload a chart screenshot and get an instant grade or trade plan, including consumer apps available on the App Store and Google Play. Thefinaltape also offers a free, read-only environment for inspecting how deterministic trade analytics work before upgrading to a paid plan.
Recommended
Stop reviewing from memory
Run compliance scoring, tag ranking, and Kill List rules on every trade — not once a month when the account feels off.